

Top
Author
Published
27 Feb 2024Form Number
LP1895PDF size
14 pages, 924 KBSubscribed to LP1895.
Thank you for your feedback.
Abstract
VMware Technical Support routinely requests diagnostic information from you when a support request is handled. The diagnostic information contains product-specific logs, configuration files, and data appropriate to the situation. The information is gathered with specific scripts and tools and can include a host support bundle from the ESXi host and vCenter Server support bundle.
This paper provides procedures for obtaining diagnostic information for a VMware vCenter and ESXi host using the command line utility, vSphere Web client, and vSphere PowerCLI. The paper introduces the VMware Skyline Health Diagnostic tool to analyze log bundles and suggest the VMware KnowledgeBase entry to remediate the issue.
Introduction
This paper describes two scripts, vm-support and vc-support, and the VMware Skyline Diagnostic Tool.
The vm-support is a useful tool provided by VMware to gather diagnostics information, troubleshoot issues, and understand the setup from the support side. vm-support is a simple script which gathers required logs from various files, core-dump if present, and information on the state of the virtual machines. The vc-support is a tool to collect vCenter based OS logs.
The vm-support works using two steps:
- Collect the diagnostic logs from various locations. The support tool will collect logs from different components like vmkernel, host, CIM, virtual machines, security, vpxa, cronjobs, dmesg, update logs and many other diagnostic logs which are helpful to clarify the state of the system.
- Collect configuration information of the NICs, switches, storage adapters, NAS mounts, multi-path setup, and many other details. To obtain such data, the vm-support tool triggers a list of commands which obtain the required results and stores them in the respective file under the vm-support bundle.
VMware Skyline Health Diagnostics for vSphere is a self-service tool to detect issues using log bundles and suggest the KB remediating the issue in the vSphere and vSAN product line. vSphere administrators can use this tool for troubleshooting issue before contacting VMware Support.

Figure 1. VMware Skyline Health Diagnostics process
Collecting logs from the command line
To collect vm-support logs from a command line interface, do the following:
- Connect and login to VMware Host via ssh or open shell console from DCUI.
- To gather logs using vm-support, and export the log bundle to a shared vmfs datastore, use the following command
vm-support -w /vmfs/volumes/DATASTORE_NAMEThe output from the command is shown in the following figure:
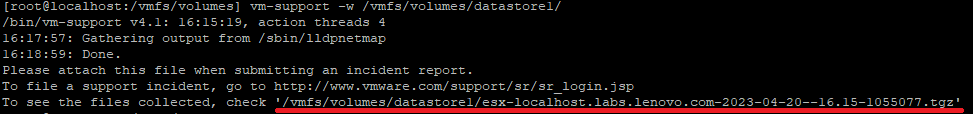
Figure 2. Output from the vm-support command - Confirm that log bundle is created with tgz extension.
- Copy the result file using scp or sftp. Send the logs to Lenovo Support if they're handing a support case.
To collect vc-support logs from a command line interface, do the following:
- Login to SSH to vCenter Server Appliance as root.
- Enter the following commands to export the logs to /storage/log/:
shell.set --enabled true
shell
vc-support -l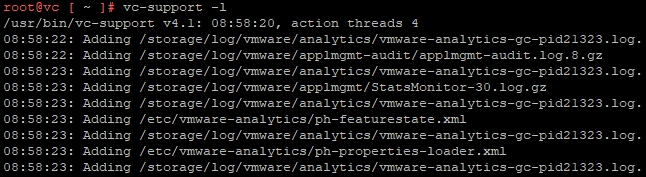
Figure 3. Output from vc-support -l - Confirm that log bundle is created with tgz extension.
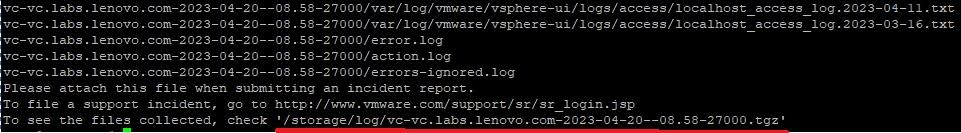
Figure 4. Output - Copy the result file using scp or sftp. Send the logs to Lenovo Support if they're handing a support case.
Collecting logs using the vSphere Web Client
To gather vm-support and vc-support using vSphere Web Client, do the following:
- In a browser, enter the URL or IP address of the web client and logon into a web client.
- In the Hosts and Clusters view, Select the ESXi hosts which you want to export logs.
- Perform one of the followings:
- Right-click the vCenter Server object and click Export System Logs.
- Click Actions and click Export System Logs.
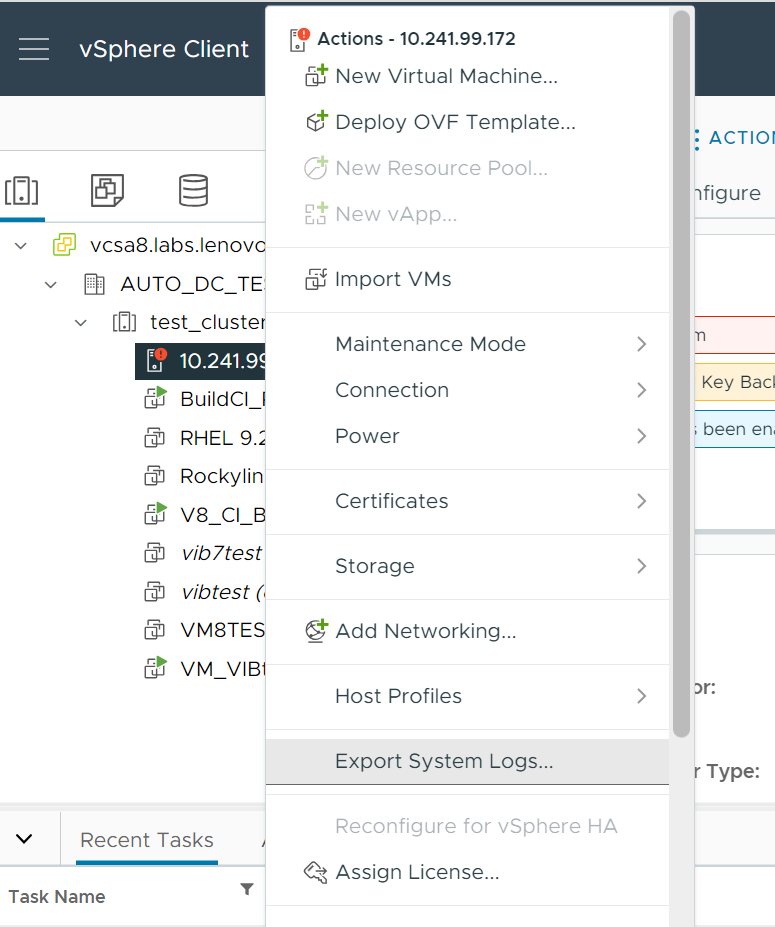
Figure 5. Selecting Export System Logs - Select the ESXi hosts for which you want to export logs.
- Optionally, to collect diagnostic data for the vCenter Server itself, select the Include vCenter Server and vSphere UI Client logs option.
- Click Next.
- Optionally, select Gather performance data to include performance data information in the log files. This is optional and should only be selected if performance data is needed.
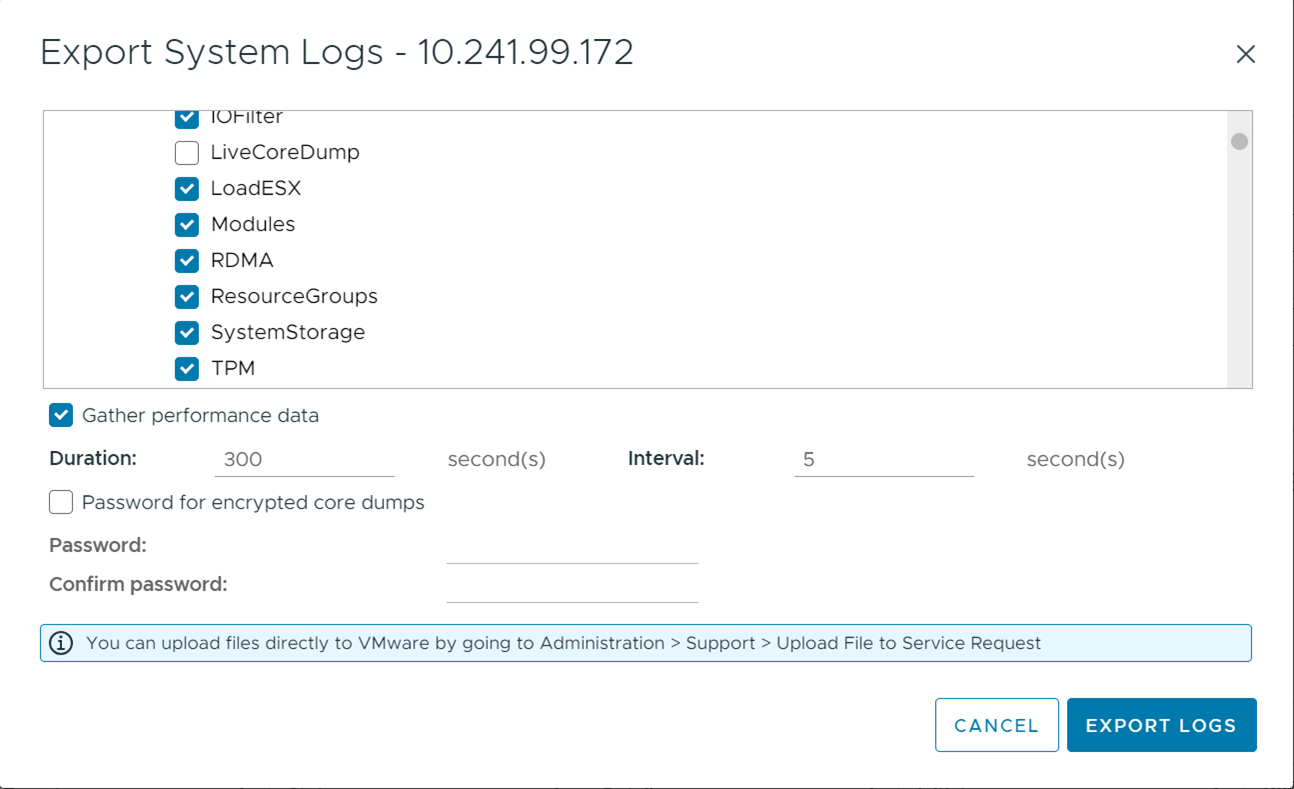
Figure 6. Export Logs - Click the Export Logs button to save the bundle to your local computer.
Collecting logs using vSphere PowerCLI
To gather vc-support logs using vSphere PowerCLI, do the following:
- Launch Windows PowerShell.
- Install vSphere PowerCLI with command:
Install-Module VMware.PowerCLI -Scope CurrentUser - Connect to vCenter with the following command
Connect-VIServer -Server HostnameOrIPAddressYou will see an output similar to the image below:
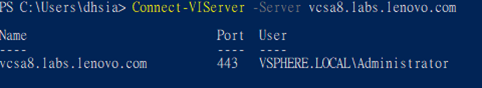
Figure 7. Connect-VIServer command - Download log with command
Get-Log -Bundle -DestinationPath c:\temp\You see output similar to:
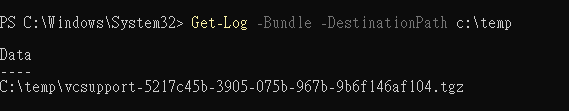
Figure 8. Get-Log command
To gather vm-support logs using vSphere PowerCLI, do the following:
- Launch Windows PowerShell
- Install vSphere PowerCLI with command
Install-Module VMware.PowerCLI -Scope CurrentUser - Connect to VMware host with command
Connect-VIServer -Server HostnameOrIPAddressYou see output similar to:
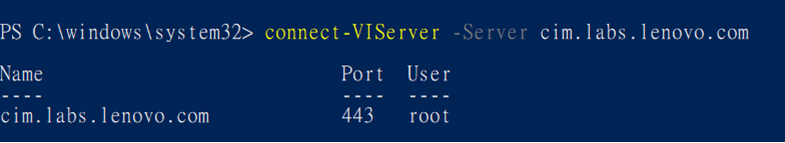
Figure 9. Connect-VIServer command - Download log with command
Get-VMHost HostNameOrIP | Get-Log -Bundle -DestinationPath c:\tmp\You see output similar to:
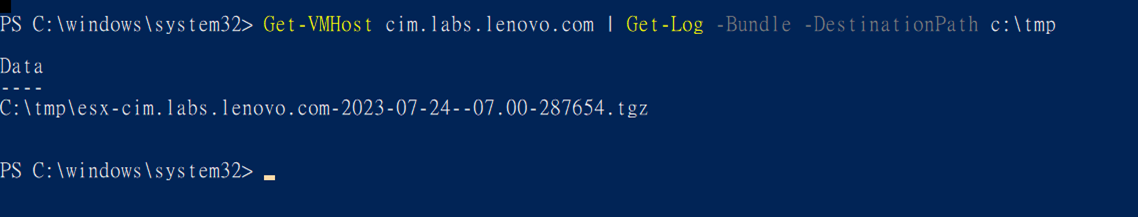
Figure 10. Get-VMHost command
Collecting logs using HTTP download
To download vm-support logs using HTTPS from an ESXi host, do the following:
- Using any web browser, navigate to:
https://ESXHostnameOrIPAddress/cgi-bin/vm-support.cgi - Logon with VMware network Management account and password
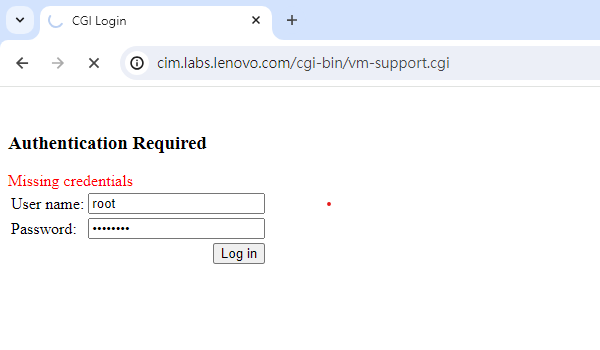
Figure 11. vm-support.cgi page - Select a folder for file download.
VMware Skyline Health Diagnostic tool
To deploy VMware Skyline Health Diagnostics using the OVA image, follow these steps:
- Download the ova image for VMware Skyline Health Diagnostic from the following VMware web page:
https://customerconnect.vmware.com/downloads/get-download?downloadGroup=SKYLINE_HD_VSPHERE - Deploy the ova on ESXi and on the following Additional Settings page, configuring the following settings. This additional settings page is the customize setting items in the OVA deploy for Skyline Health Diagnostic tool to configure passwords for root of VM and SHD-admin web portal and configure network settings. It depends on the network infrastructure of user’s environment. The table below describes the required settings.
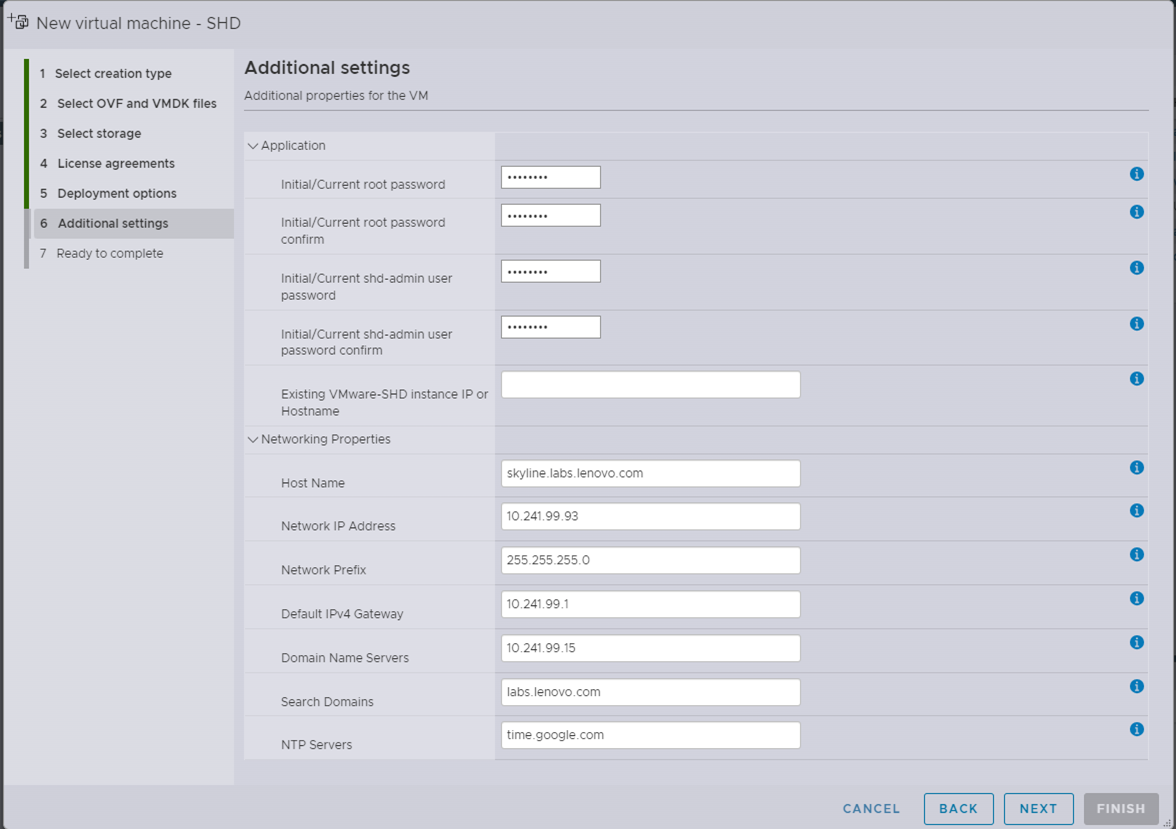
Figure 12. Additional Settings pageTable 1. Setting items for the Customize template page of OVA Image deployment Setting Value Initial/Current root password
The password of the root user of VMware Photon operating system.
The password must be a minimum of 8 characters and include at least one uppercase, one lowercase, one digit, and one special character.
Initial/Current shd-admin user password
The password for the shd-admin user account as per the security compliance policy of your organization.
The password must be a minimum of 8 characters and include at least one uppercase, one lowercase, one digit, and one special character.
Note:
VMware Skyline Health Diagnostics by default creates a user shd-admin with Administrator Role. This user account must not be deleted and is the only account available post deployment. You can use this account to login and create other accounts for further use.
Host Name
Enter the hostname or FQDN for the appliance (leave blank in case DHCP is desired).
Network IP Address
Enter the IP address for the appliance (leave blank in case DHCP is desired).
Network Prefix
Enter the network prefix for the appliance (leave blank in case DHCP is desired).
Default IPv4 Gateway
Enter the default gateway for the appliance (leave blank in case DHCP is desired).
Domain Name Servers
Enter the IP address of the primary and secondary DNS servers, comma or space separated values are accepted (leave blank in case DHCP is desired).
NTP Servers
Enter the NTP server or servers. Enter comma or space separated values if entering multiple NTP servers. NTP servers can be entered using FQDNs or IP addresses.
- On the Ready to complete page, click Finish, and wait for the completion of the task.
- Power on the new VM. The OS boots up and login as root with your password that you set in previous step.
- If you can’t start the nginx service because you get a crt file missing error, use following commands to create crt:
cd /opt/vmware-shd/vmware-shd/conf/ssl/
openssl req -new -x509 -nodes -sha256 -days 365 -key rui.key -out rui.cert
Using VMware Skyline
There are two ways to analyze diagnostic logs using the VMware Skyline Health Diagnostic tool:
- Direct connection
- Offline bundle
Direct connection:
- Login SHD web.
- Click Analyze
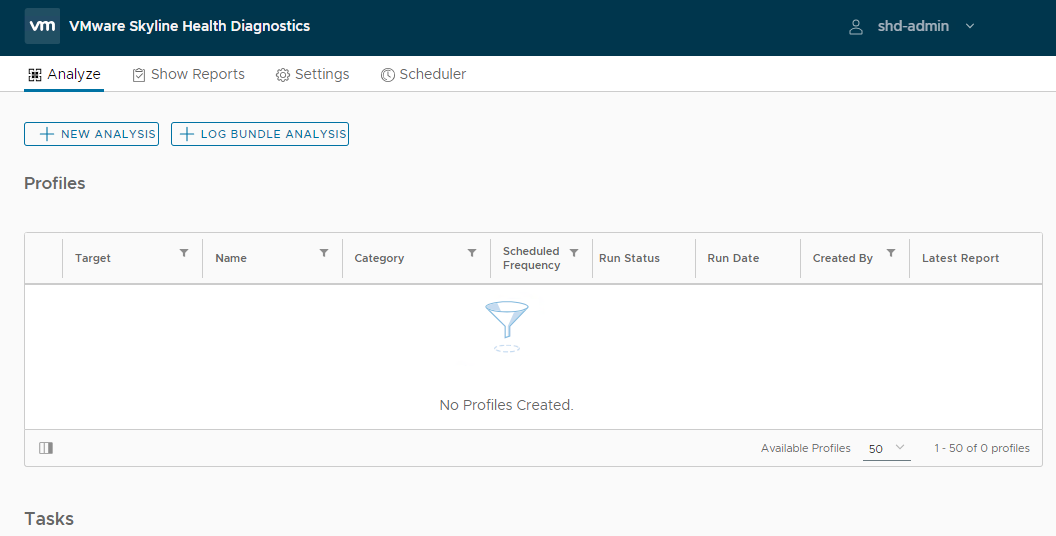
Figure 13. Analyze page - Click New Analysis
- Select the Product and select diagnostics item.
- Input the target FQDN or IP address, and the password, and click Connect.
- Click Run to collect the download the log.
Offline bundle log:
- Login SHD web.
- Click Analyze
Figure 14. Analyze page - Click Log bundle analysis
- Select the local file or remote file.
- Click Next for Profile page.
- Click Run to upload log and validation log.

Figure 15. Tasks page - After the task is completed, click Show Reports on the top menu. The issues and suggested KB show on the Detail list. You can then click the link to check the details on the VMware website.
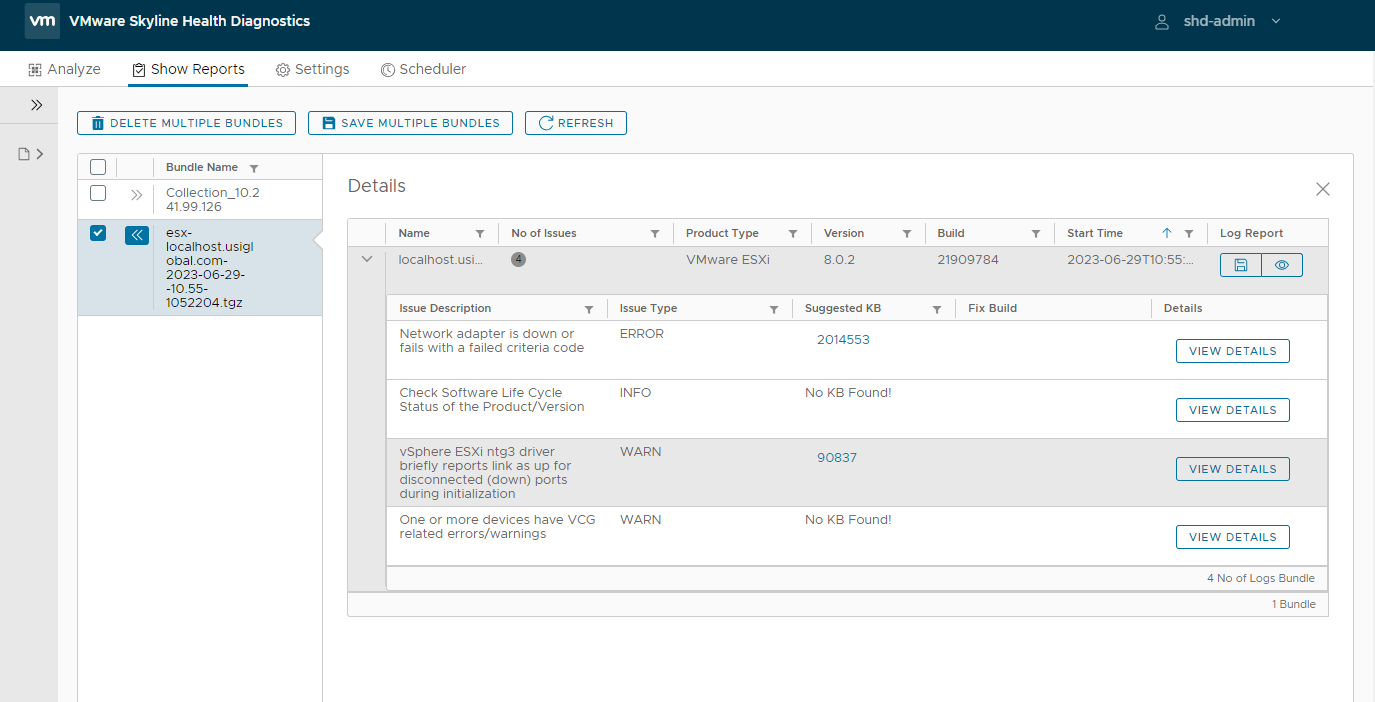
Figure 16. Show Reports page
Log files
The following table lists the important log files in VMware ESXi, along with location of the log and its purpose. These files are logs which are collected by vm-support.
| Component | Location | Purpose |
|---|---|---|
| Authentication | /var/log/auth.log | Contains all events related to authentication for the local system. |
| ESXi host agent log | /var/log/hostd.log | Contains information about the agent that manages and configures the ESXi host and its virtual machines. |
| Shell log | /var/log/shell.log | Contains a record of all commands typed into the ESXi Shell and shell events (for example, when the shell was enabled). |
| System messages | /var/log/syslog.log | Contains all general log messages and can be used for troubleshooting. This information was formerly located in the messages log file. |
| vCenter Server agent log | /var/log/vpxa.log | Contains information about the agent that communicates with vCenter Server (if the host is managed by vCenter Server). |
| Virtual machines | The same directory as the affected virtual machine's configuration files, named vmware.log and vmware*.log. For example, /vmfs/volumes/datastore/virtual machine/vmware.log | Contains virtual machine power events, system failure information, tools status and activity, time sync, virtual hardware changes, vMotion migrations, machine clones, and so on. |
| VMkernel | /var/log/vmkernel.log | Records activities related to virtual machines and ESXi. |
| VMkernel summary | /var/log/vmksummary.log | Used to determine uptime and availability statistics for ESXi (comma separated). |
| VMkernel warnings | /var/log/vmkwarning.log | Records activities related to virtual machines. |
| Quick Boot | /var/log/loadESX.log | Contains all events related to restarting an ESXi host through Quick Boot. |
| Trusted infrastructure agent | /var/run/log/kmxa.log | Records activities related to the Client Service on the ESXi Trusted Host. |
| Key Provider Service | /var/run/log/kmxd.log | Records activities related to the vSphere Trust Authority Key Provider Service. |
| Attestation Service | /var/run/log/attestd.log | Records activities related to the vSphere Trust Authority Attestation Service. |
| ESX Token Service | /var/run/log/esxtokend.log | Records activities related to the vSphere Trust Authority ESX Token Service. |
| ESX API Forwarder | /var/run/log/esxapiadapter.log | Records activities related to the vSphere Trust Authority API forwarder. |
Resources
For additional information, see these resources:
- “vm-support” command in ESX/ESXi to collect diagnostic information
https://kb.vmware.com/s/article/1010705 - Collecting diagnostic information for VMware vCenter Server 4.x, 5.x, 6.x and 7.0
https://kb.vmware.com/s/article/2032892 - How to collect the diagnostic Information from ESXi hosts using the vm-support command.
https://support.lenovo.com/us/en/solutions/ht509801-how-to-collect-the-diagnostic-information-from-esxi-hosts-using-the-vm-support-command - VMware Skyline Health Diagnostics Guide and OVA download page
https://customerconnect.vmware.com/downloads/get-download?downloadGroup=SKYLINE_HD_VSPHERE - VMware Document for VMware Skyline Health Diagnostics Tool
https://docs.vmware.com/en/VMware-vSphere/8.0/vsphere-monitoring-performance/GUID-D9DDF7B6-1F44-4F0F-BFE7-0DBCAF2F8CA5.html
Author
David Hsia is an OS Engineer in the Lenovo Infrastructure Solutions Group, based in Taipei, Taiwan. As a specialist in Linux and VMware technical support, he is interested in operating system and focuses on VMware vSphere and ESXi.
Thanks to the following specialists for their contributions and suggestions:
- Chengcheng Peng, Lenovo VMware Engineer
- Alpus Chen, Lenovo VMware Engineer
- Chia-Yu Chu, Lenovo VMware Engineer
- Gary Cudak, Lenovo OS Architect
- David Watts, Lenovo Press
Related product families
Product families related to this document are the following:
Trademarks
Lenovo and the Lenovo logo are trademarks or registered trademarks of Lenovo in the United States, other countries, or both. A current list of Lenovo trademarks is available on the Web at https://www.lenovo.com/us/en/legal/copytrade/.
The following terms are trademarks of Lenovo in the United States, other countries, or both:
Lenovo®
The following terms are trademarks of other companies:
PowerShell, Windows PowerShell®, and Windows® are trademarks of Microsoft Corporation in the United States, other countries, or both.
Other company, product, or service names may be trademarks or service marks of others.
Configure and Buy
Please select a locale


