

Top
Author
Updated
12 Apr 2024Form Number
LP1655PDF size
40 pages, 5.0 MBSubscribed to LP1655.
Thank you for your feedback.
Table of Contents
Abstract
This document provides the instructions for the various methods of collecting service data on Lenovo servers for users who are new to Lenovo ThinkSystem servers. It explains the new service data log in ThinkSystem V3 servers, guides you to choose the right tool and shows how to complete the task of collecting service data, which you can send to the qualified service personnel as the next step in the troubleshooting journey.
Change History
Changes in the April 12, 2024 update:
- New section Redfish API LogServices
- Updated the links to the Lenovo documentation, now on: https://pubs.lenovo.com/software
Introduction
This document provides the instructions for the various methods of collecting service data on Lenovo servers. Users might be asked to collect service data by Lenovo service personnel or from a qualified business partner when opening a service ticket. This is sometimes referred to as collecting FFDC – short for First Failure Data Capture.
This guide provides simple instruction for users who are new to Lenovo ThinkSystem servers. It will explain the new service data log in ThinkSystem V3, guide you to choose the right tool and show how to complete the task of collecting service data, which you can send to the qualified service personnel as the next step in the troubleshooting journey.
Looking for System x? For information on System x servers, see Collecting Service Data on Lenovo ThinkSystem and System x servers.
Server covered in this guide
This guide covers the following servers:
- All ThinkSystem V3 servers
- All ThinkSystem V2 servers, except the ST50 V2
- All ThinkSystem servers, except SR635, SR655, ST50
- ThinkEdge servers (includes SE350)
SR635 and SR655: The ThinkSystem SR635 and SR655 servers have a firmware stack that is different from other ThinkSystem servers, so the tools and instructions in this guide don’t apply to those servers. You can use the embedded ThinkSystem System Manager to collect service data as documented in https://pubs.lenovo.com/tsm/download_service_data.
ST50 and ST50 V2: The ThinkSystem ST50 and ST50 V2 tower servers don’t have a BMC onboard for collecting service data, so the tools and instructions in this guide don’t apply to those servers.
New service data log
Service data log used to be saved as proprietary file format. It required a proprietary tool to open the file and specialized skills to make sense of the content.
ThinkSystem servers now offer a service data log (mini log) that is user-friendly and significantly more compact. This new service log feature is available with all new ThinkSystem V3 servers and also with ThinkSystem and ThinkSystem V2 servers that have XCC firmware dated May 2023 or later.
The log is now saved as zip format and shrunk to a much smaller size (about 500KB). You can expand the zip file to read the export.html content in any browser, while individual log files are also provided side-by-side in json format for easy parsing.
The naming convention for the service data log file is: MachineType+Model_SerialNumber_xcc_mini-log_date_time.zip
e.g., 7D76WCC_1234567890_xcc_mini-log_20221024-023341.zip

Figure 1. XCC2 download dialog showing the new service data log and the debug log (aka FFDC)
You can decompress the zip file using Windows Explorer or a third-party tool (unzip, 7zip) to view all the files. Here is an example of the new service data log content.
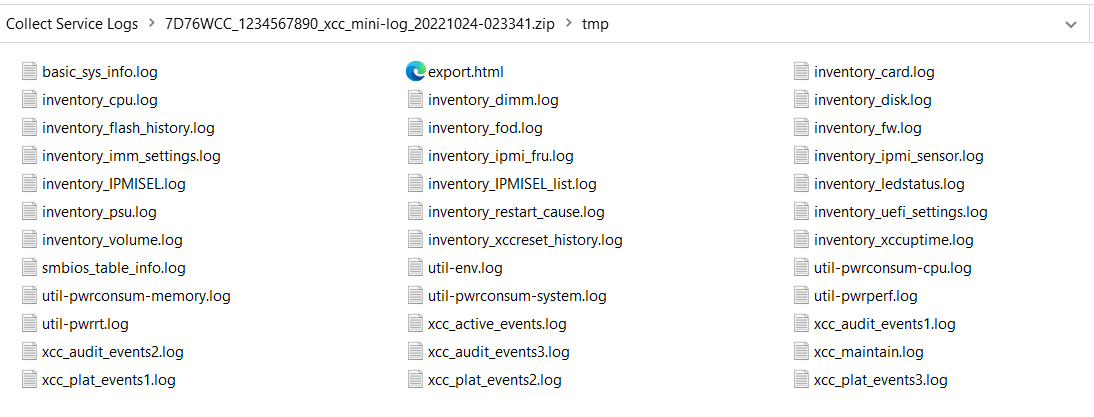
Figure 2. Expanded file list from the new service data log file
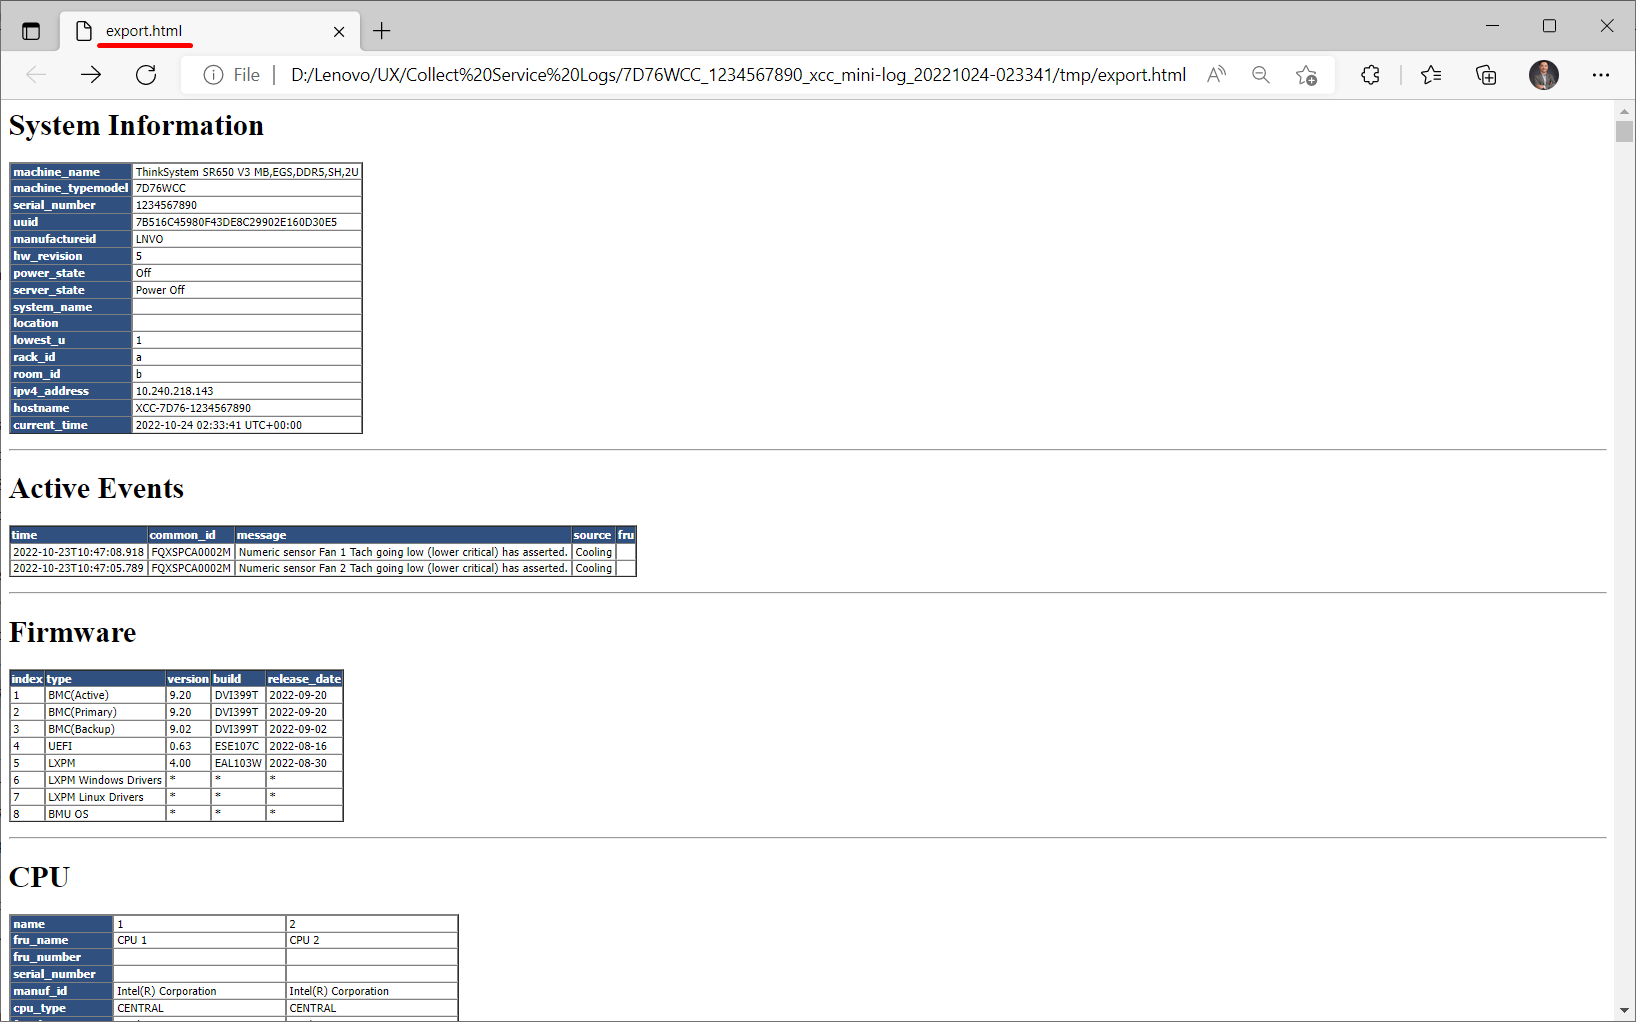
Figure 3. Sample content from the export.html file
As you can see in the example, the new service data content is easily readable by users with only minimal technical skills. It also brings log data transparency because now the user can see and choose what get sent out to Lenovo or to a service provider.
While it is great that the new service data log is user-readable and compact, it doesn’t contain the debugging data that is sometimes required for deeper troubleshooting. As a result, the former proprietary log file will be continue to be available but is now called debug log. The file format and content remain exactly as before. When XCC2 captures a service data log (zip file), it automatically captures a debug log (tzz file) in parallel just in case it might be needed.
The naming convention for the debug log file is: MachineType+Model_SerialNumber_xcc_date_time.tzz
e.g., 7D76WCC_1234567890_xcc_20221024-023341.tzz
The XCC service data file *.tzz cannot be extracted using a generic decompression tool, such as unzip or 7zip. Send the service data file to an authorized technical service personnel for further analysis.
Lenovo is continuing to enhance the many service tools to take advantage of this new service data log and debug log to improve customer experience and service experience.
Choose the right tool
It is recommended that you understand all methods for collecting service data that Lenovo provides so that you can quickly collect the data before calling for technical support. This way, you can avoid or minimize workload disruption while capturing the critical information that is needed, at a decisive moment, for precise and efficient troubleshooting.
However, if you are in a hurry, the following table allows you to quickly jump to the section that best suits your current situation. Choose a row at the first column based on what you have access to, then choose one of the server brand columns to link to the right tool and steps.
| Task | Lenovo ThinkSystem V3 with Intel Xeon Scalable and AMD EPYC processors | Lenovo ThinkSystem V2 and ThinkEdge with Intel Xeon Scalable processors | Lenovo ThinkSystem with Intel Xeon Scalable and AMD EPYC processors |
|---|---|---|---|
| 1) I have access to the BMC web management interface. | Use XClarity Controller 2 (XCC2) (new service log)** | Use XClarity Controller (XCC) | |
| 2) I have access to the server OS* to run command line applications with root or Administrator privileges. | Use XClarity Essentials OneCLI (LXCE) V4.0 (new service log)** | Use XClarity Essentials OneCLI (LXCE) any version | |
| 3) I have access to the server locally with KVM (keyboard & video) and am able to reboot the server. | Use XClarity Provisioning Manager (LXPM) V4 | Use XClarity Provisioning Manager (LXPM) V3 | |
| 4) I am managing the servers with XClarity Administrator and would like to use it to collect service data on one or more servers. | Use XClarity Administrator (LXCA) V4.0 (new service log)** | Use XClarity Administrator (LXCA) any version | |
| 5) I’m managing the servers with XClarity Orchestrator and would like to use it to collect service data on one or more servers. | Use XClarity Orchestrator | ||
| 6) I am managing the servers with XClarity Integrator from the Windows Admin Center console | Use XClarity Integrator for Windows Admin Center | ||
| 7) I am managing the server using XClarity Mobile app on a smart phone running iOS or Android | Use XClarity Mobile app | ||
| 8) I am in front of the server but do not have access to a KVM or a mobile phone. | Use the external diagnostics handset or integrated diagnostics panel | ||
| 9) I’d like to use standard Redfish API with scripting tools. | Use Redfish API LogServices | Not supported | |
* The OS here refers to a supported version of Windows and Linux on the server, such as Microsoft Windows Server 2019; RHEL 8; SLES 15. Although VMware ESXi is also supported on the server but it cannot run application directly in the hypervisor, in that case user can use the XClarity Controller, XClarity Administrator or XClarity Provisioning Manager to collect service data.
** These tools are capable of collecting the new user-friendly service data log as well as debug log; other tools are planned to be enhanced to also offer the new service logs.
XClarity Controller 2 (XCC2)
XClarity Controller 2 is the integrated baseboard management controller (BMC) available in all ThinkSystem V3 servers. It continuously monitors the server hardware health status and handle alerts immediately. It plays a key role in ensuring the server firmware authenticity, safety, and integrity. Finally, it also helps to collect service data log and debug log.
Accessing the tool:
- Download: This tool is embedded in the firmware of Lenovo ThinkSystem V3 servers.
- Documentation: https://pubs.lenovo.com/xcc2/
Use the following steps to collect service data using XClarity Controller 2 (XCC2):
- Log in to web management interface.
- At the Home page, look for the Service Log button at the top banner or in the Quick Actions card as shown in the following figure.
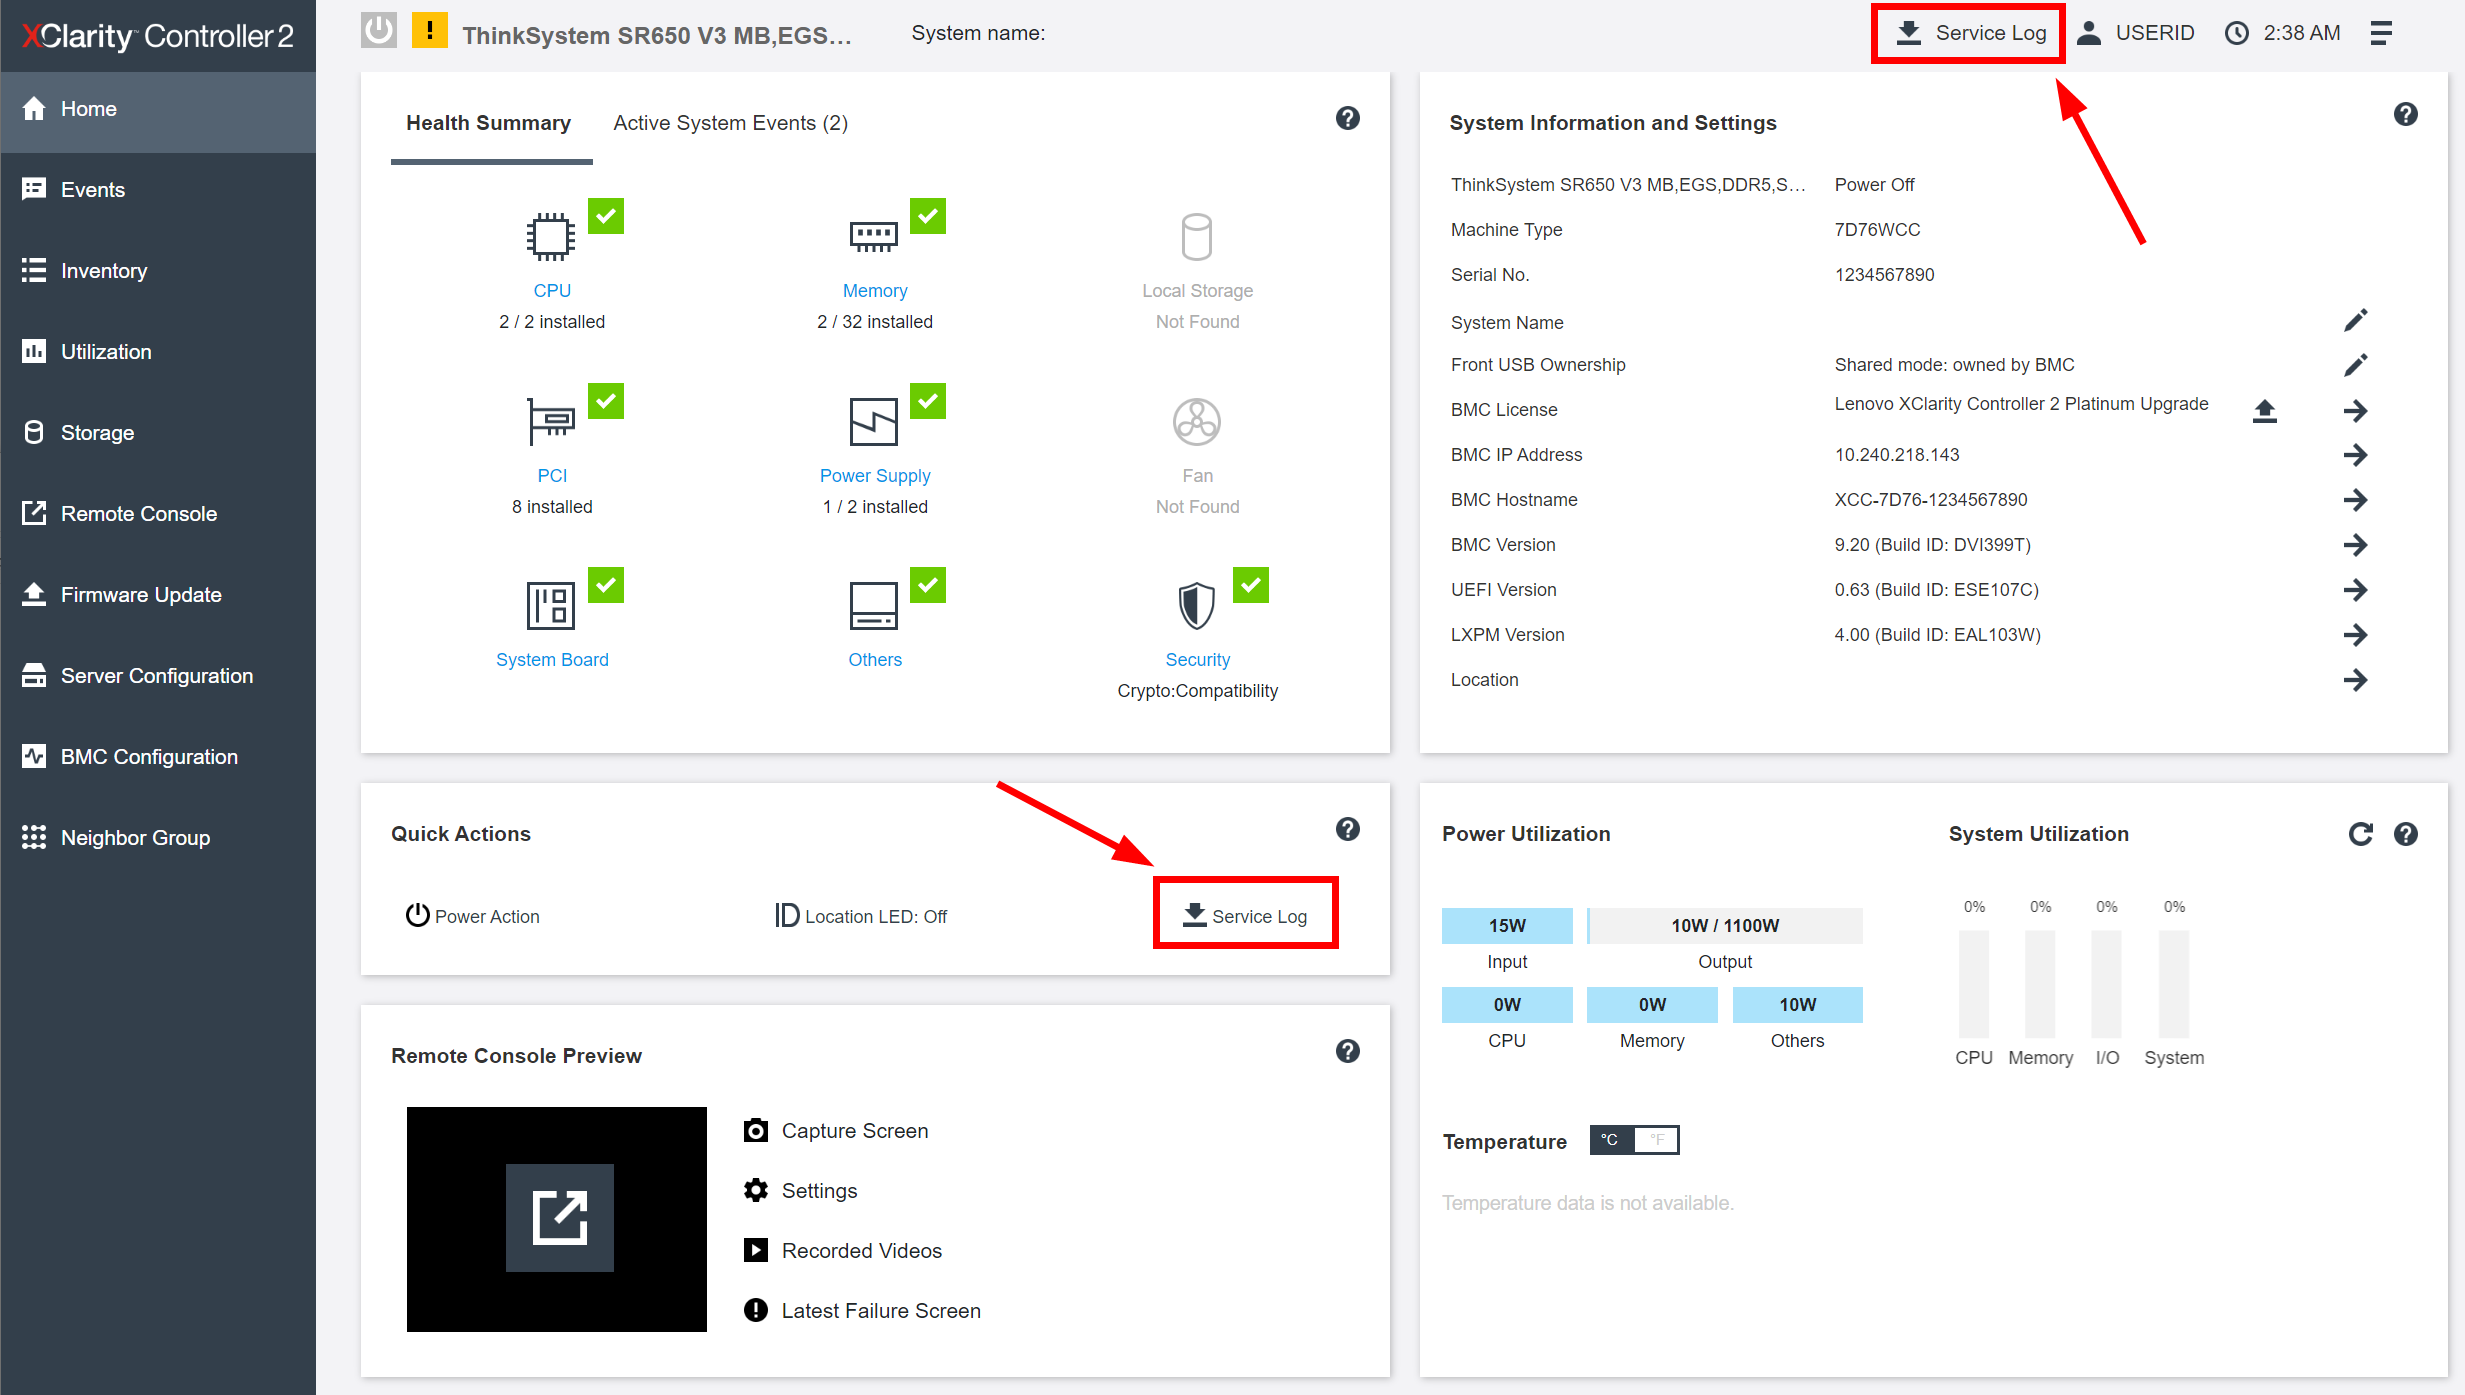
Figure 4. XClarity Controller 2 home page - Select the Service Data Log (default) or Debug Log, pay attention to the optional data that could be collected as well if needed.

Figure 5. Select the type of service log to collect - Click Export to collect the data. This may take around 15 seconds to complete, then you will be prompted by the browser to save the file to your workstation.
- At any time, you may click on the Browse History button to download previously collected service logs.
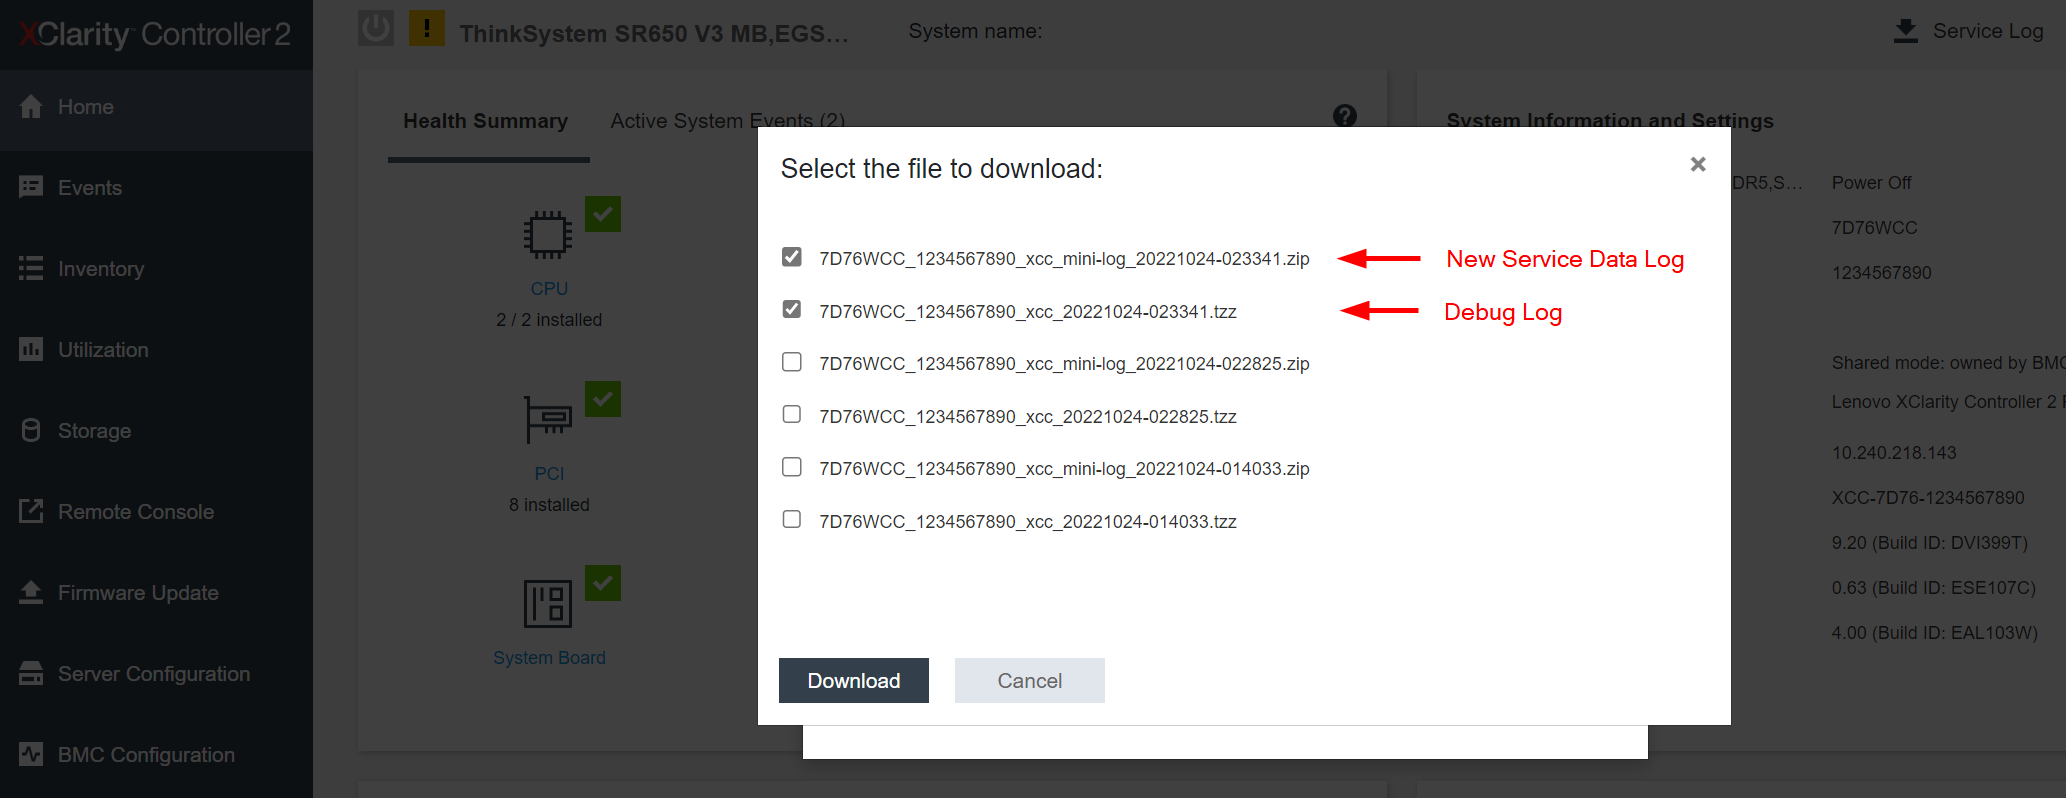
Figure 6. Go to Browse History to download previously collected service logs
XClarity Controller (XCC)
XClarity Controller is the integrated baseboard management controller (BMC) available in all ThinkSystem V1 and V2 servers, with the exception of the ST50, ST50 V2, SR655, and SR635 servers. It continuously monitors the server hardware health status and handle alerts immediately. It plays a key role in ensuring the server firmware authenticity, safety, and integrity. Finally, it also helps to collect service data log and debug log.
Service data log: The enhanced new service data log feature has been added to ThinkSystem V1 and V2 servers with the XClarity Controller (XCC) firmware update released after May 2023. After you update the XClarity Controller firmware, the user interface for collecting service log will be similar to that of XClarity Controller 2.
Accessing the tool:
- Download: This tool is embedded in the firmware of the server
- Documentation:
Use the following steps to collect service data using XClarity Controller (XCC):
- Log in to XClarity Controller web management interface.
- At the Home page, look for the Quick Actions card as illustrated in Figure 1.
- Click on the Service dropdown menu, then Download Service Data.
- Click OK when prompted.
- This may take a few minutes to complete, then you will be prompted by the browser to save the file to your workstation.
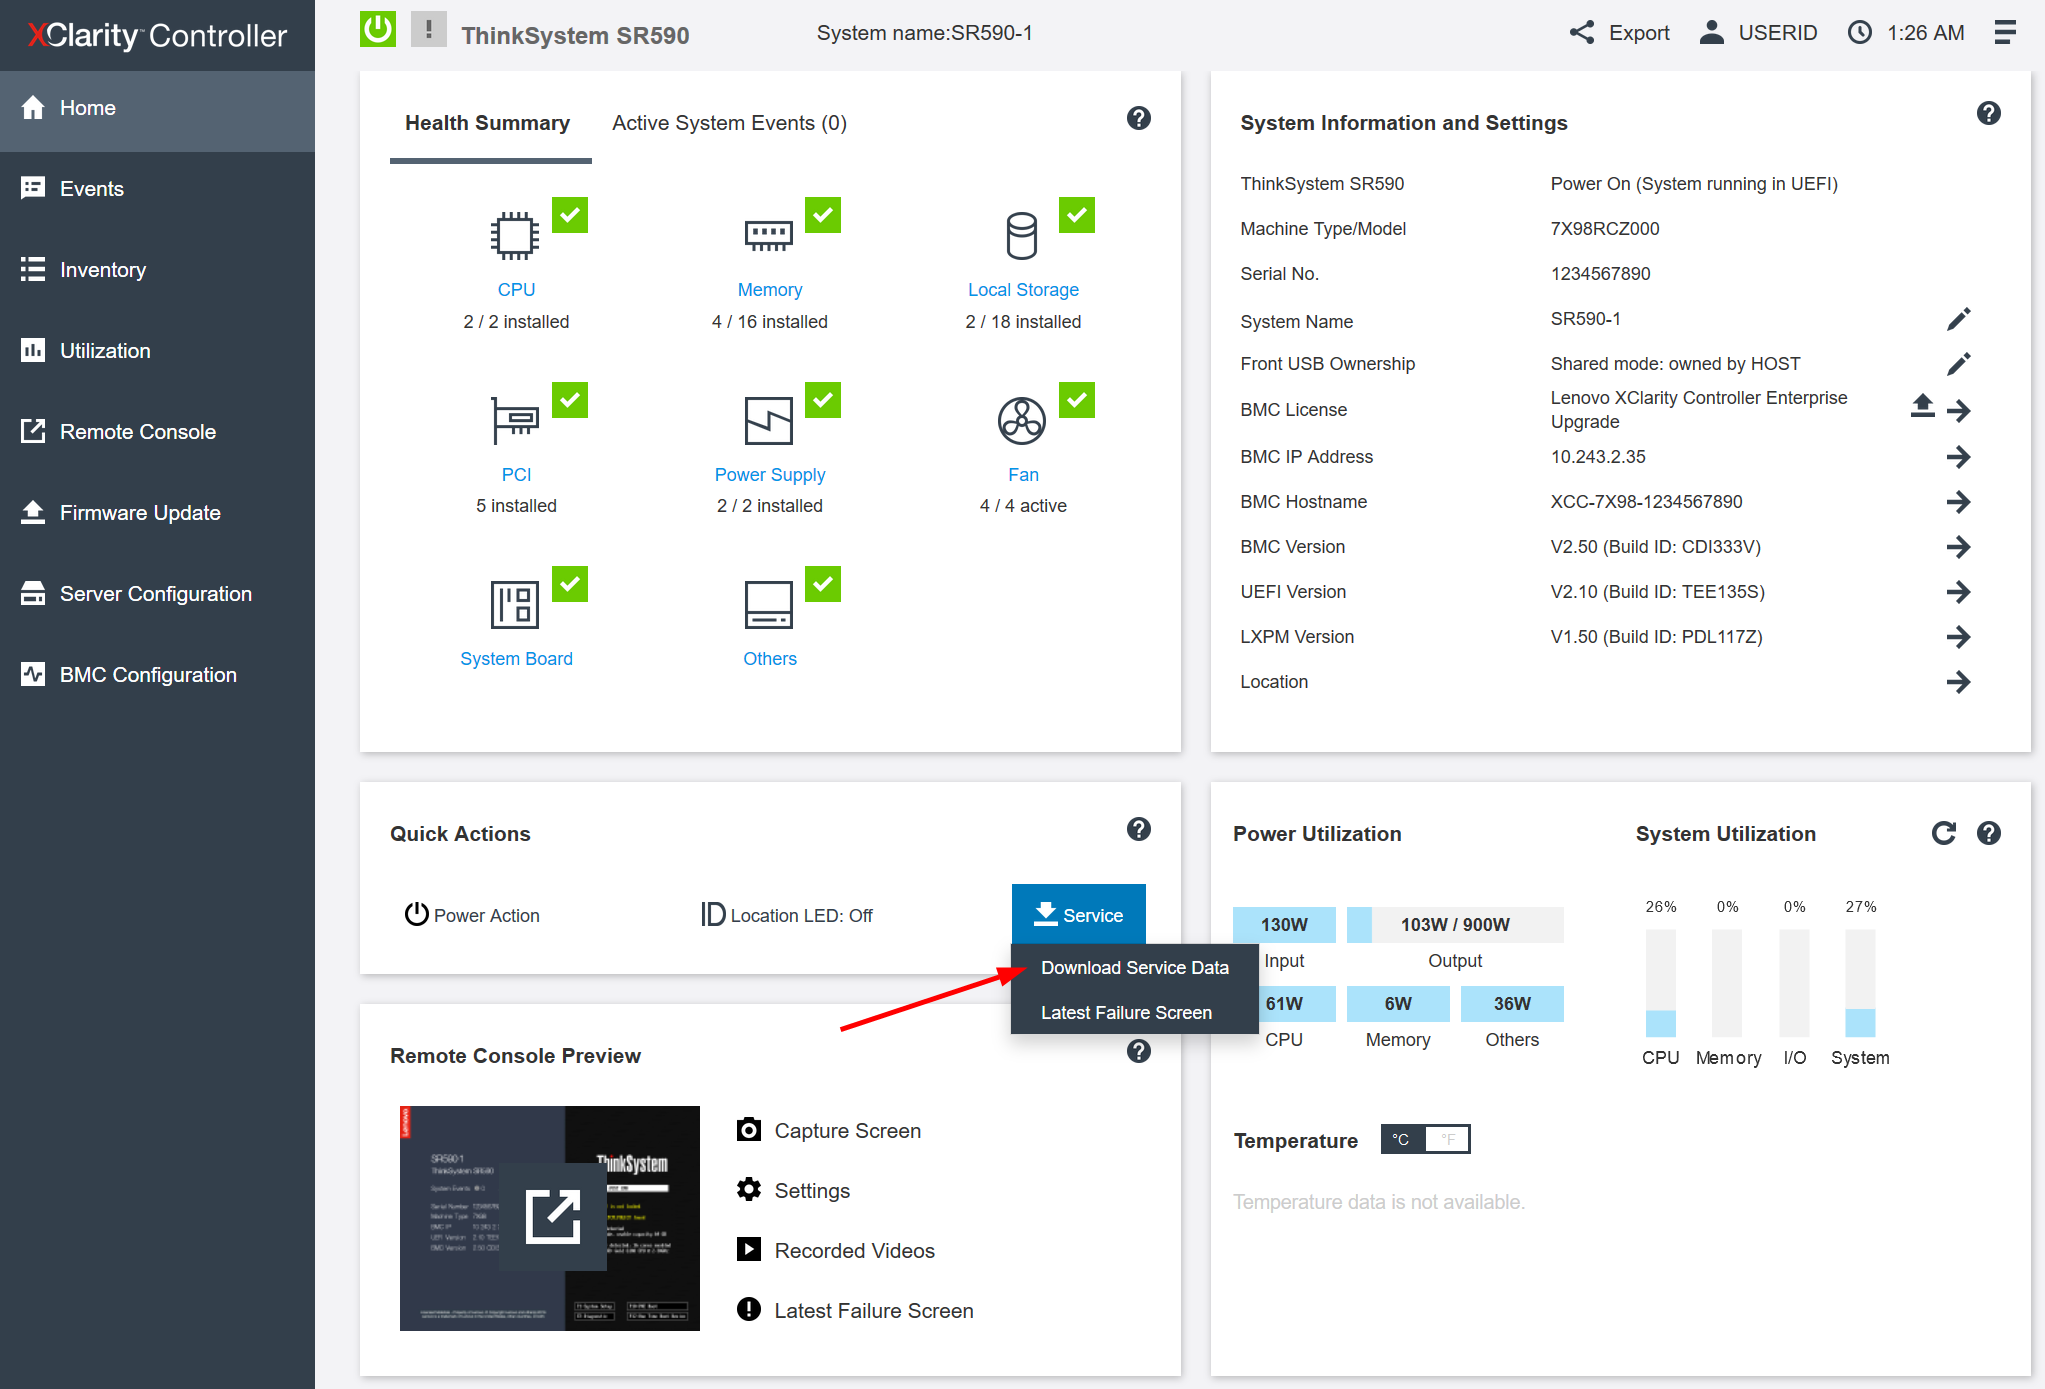
Figure 7. XClarity Controller home page
XClarity Essentials OneCLI (LXCE)
XClarity Essentials provides a collection of graphical interface and command line tools for viewing, configuring, and updating ThinkSystem servers. The tools can run inside the target server OS to act on itself, or they can run on a remote PC to act on one or many servers.
This guide provides instruction for the command line tool called OneCLI, running inside the target server OS. But it is also possible to run the same OneCLI command from a remote Windows or Linux PC, provide that the target server’s XClarity Controller is accessible on the network and that you have the administrative credentials.
Accessing the tool:
- Download: https://datacentersupport.lenovo.com/us/en/solutions/lnvo-tcli
- Documentation: https://pubs.lenovo.com/lxce-onecli/
Use the following steps to collect service data using XClarity Essentials OneCLI (LXCE).
Instruction for Windows:
- Download the latest version of OneCLI from the above location.
- Decompress the downloaded zip file into a new directory.
- Open a command prompt as Administrator and change to the directory where the expanded version of OneCLI is found.
- Run this command to collect service data log: (must have XCC2 and OneCLI V4.0 or later)
OneCli.exe inventory getinfor --servicelog - Run this command to collect debug log: (applicable to all servers and all versions of OneCLI)
OneCli.exe inventory getinfor --ffdc - It will take a minute for the service data log and approximatively 15-45 minutes for the debug log to complete.
Instruction for Linux:
- Download the latest version of OneCLI from the above location.
- Decompress the downloaded .tgz file into a new directory.
- Open a shell as root privilege and change to the directory where the expanded version of OneCLI is found.
- Run this command to collect service data log: (must have XCC2 and OneCLI V4.0 or later)
./OneCli inventory getinfor --servicelog - Run this command to collect service data: (applicable to all servers and all versions of OneCLI)
./OneCli inventory getinfor --ffdc - It will take a minute for the service data log and approximatively 15-45 minutes for the debug log to complete.
Additional information:
- A new directory will be created under the current execution directory to store the result of each run at logs/OneCli-pid-date-time
e.g. logs/OneCli-5460-20190326-141910 - The resulting directory contains the service data log (zip) or the debug log (tzz) that was gotten from the XClarity Controller, same as by downloading service data from the web interface.
- The directory also contains a detailed server inventory file that could be useful to technical support. If you’d like to have the detailed inventory in HTML instead of the XML, you can run this command:
OneCli.exe inventory getinfor --ffdc --htmlreport - You can compress the result directory as a file to send to technical support.
- To run this command from a remote PC, add the BMC address and credentials to the command, or see this command example.
XClarity Provisioning Manager (LXPM) V4
XClarity Provisioning Manager V4 is an application preloaded in ThinkSystem V3 servers. It provides the essential functions to initialize a brand-new system all the way to OS installation wizard, including view hardware inventory, set date/time, BMC networking, RAID volume creation, UEFI setting and OS installation assistance, clone configuration. There are also functions for maintenance service, including collect service data, hardware diagnostics, firmware update, and system event log viewing.
XClarity Provisioning Manager can be used when physically in front of the server via a keyboard, video and mouse (KVM), or it can be accessed via XClarity Controller remote console.
Accessing the tool:
- Download: This tool is embedded in the firmware of the server.
- Documentation: https://pubs.lenovo.com/lxpm-overview/
Follow these steps to collect service data using XClarity Provisioning Manager. You will need a USB memory stick to save the service data to.
- Boot or reboot the server, wait until the POST splash screen is displayed.
- Press F1:System Setup.
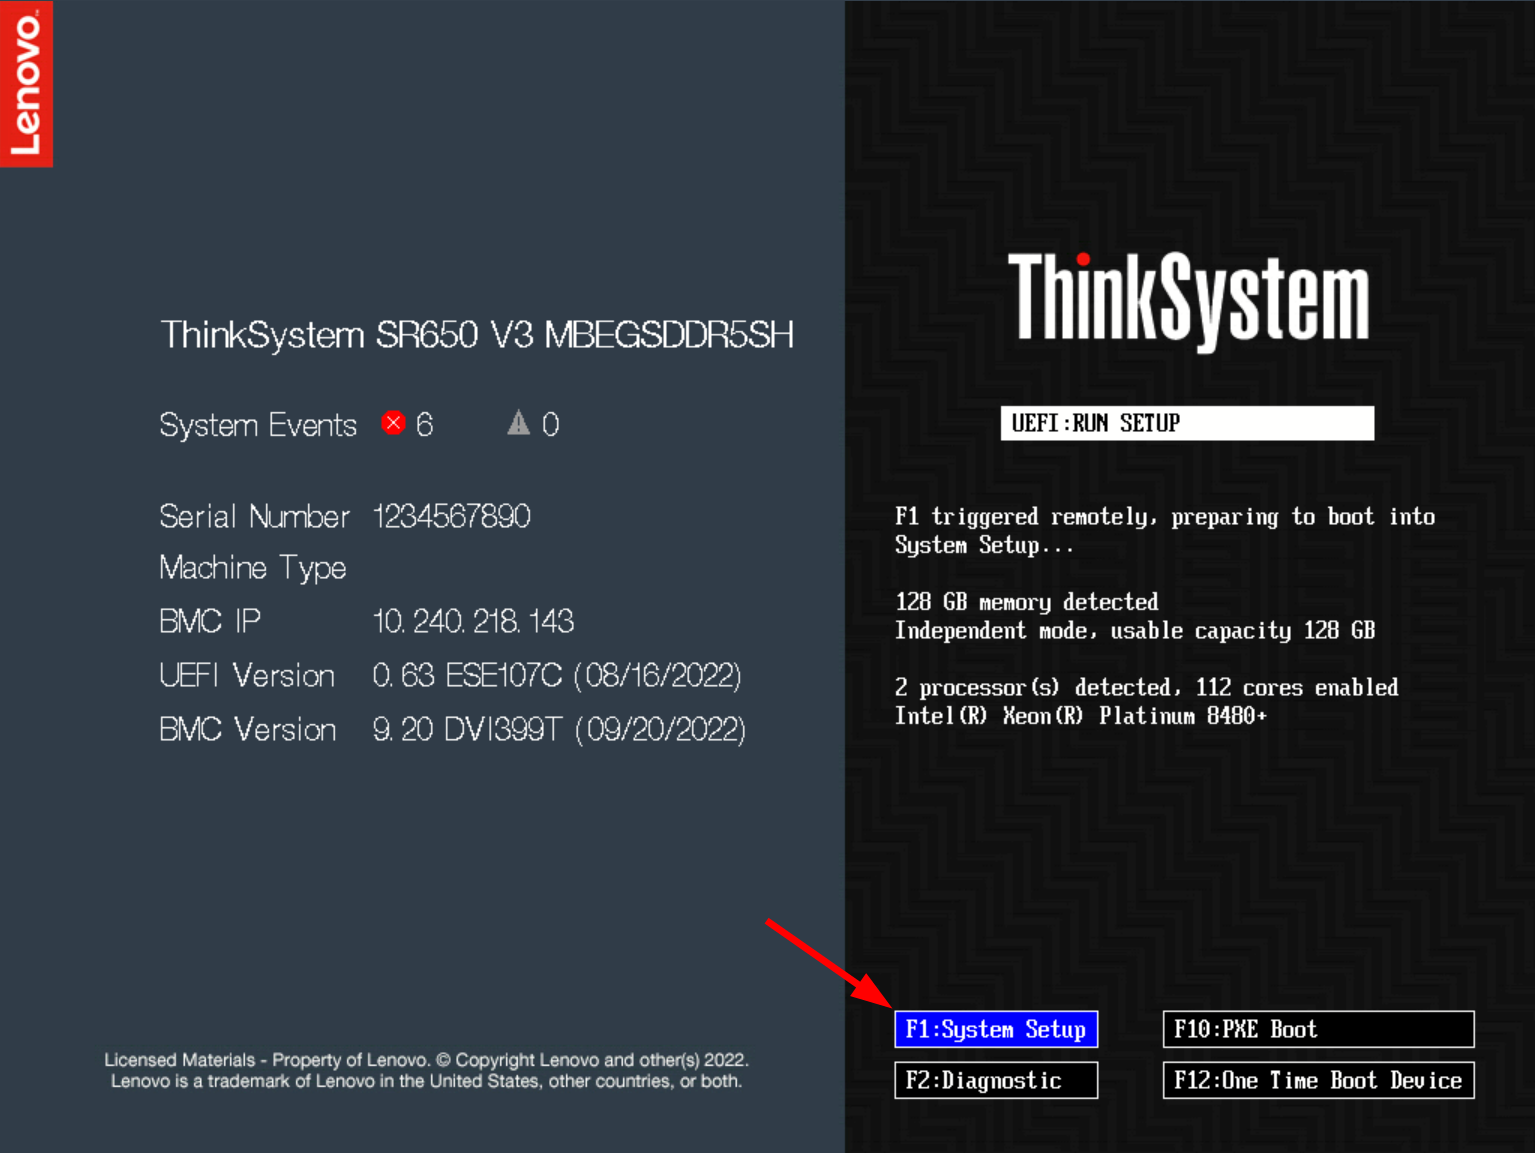
Figure 8. ThinkSystem server POST splash screen - If it shows the text mode UEFI setup, choose the option to Launch Graphical System Setup.

Figure 9. ThinkSystem server text mode UEFI setup utility - After launching into XClarity Provisioning Manager (LXPM), click on Diagnostics.
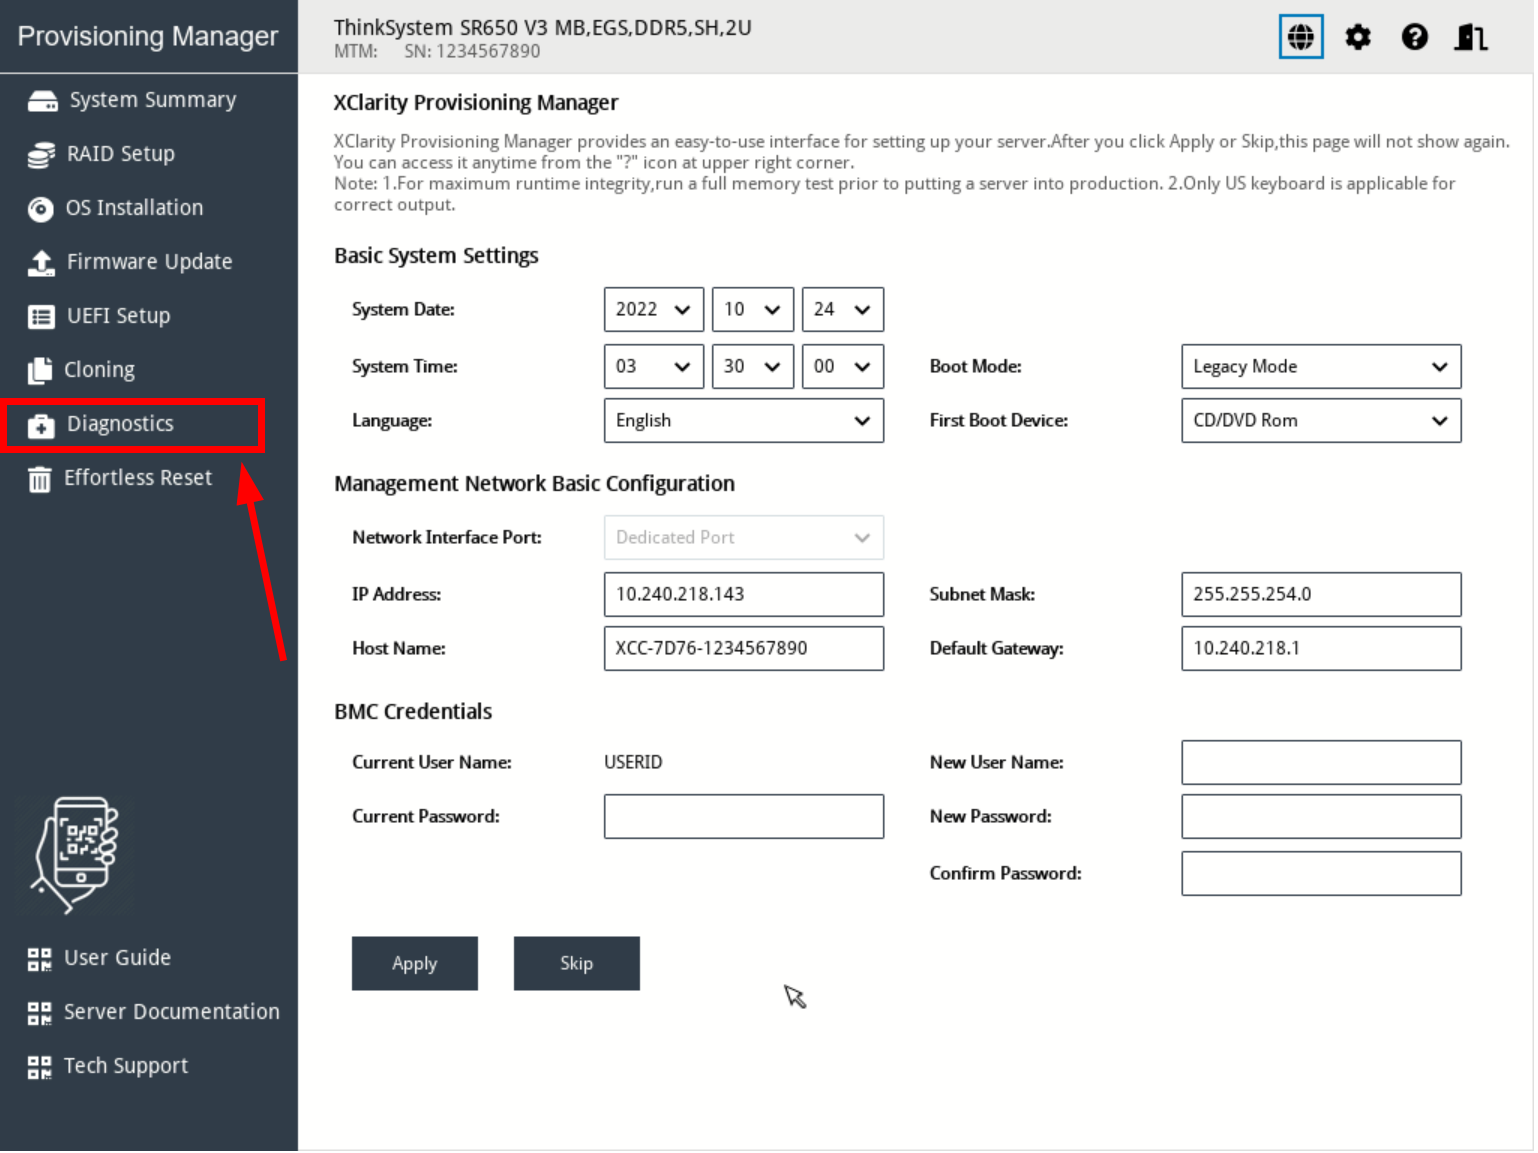
Figure 10. XClarity Provisioning Manager system summary page - Choose Collect Service Data.
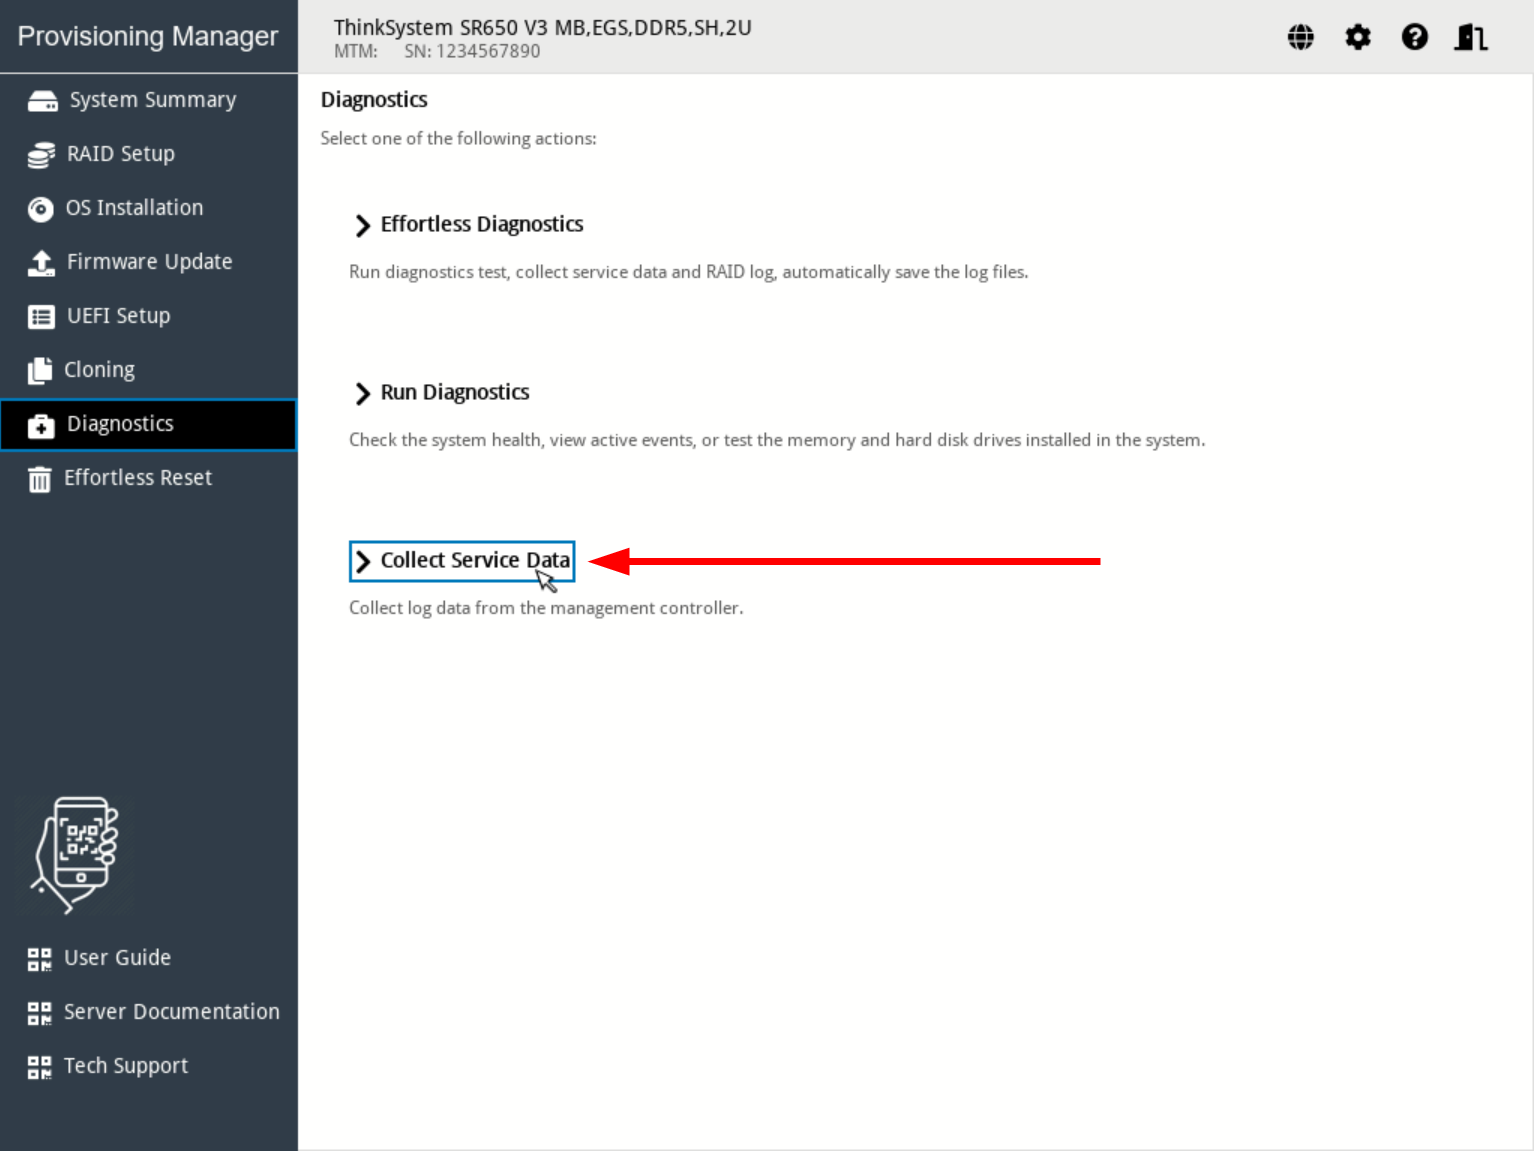
Figure 11. XClarity Provisioning Manager Diagnostics page - Wait until the task is completed then save the file to a local storage device.
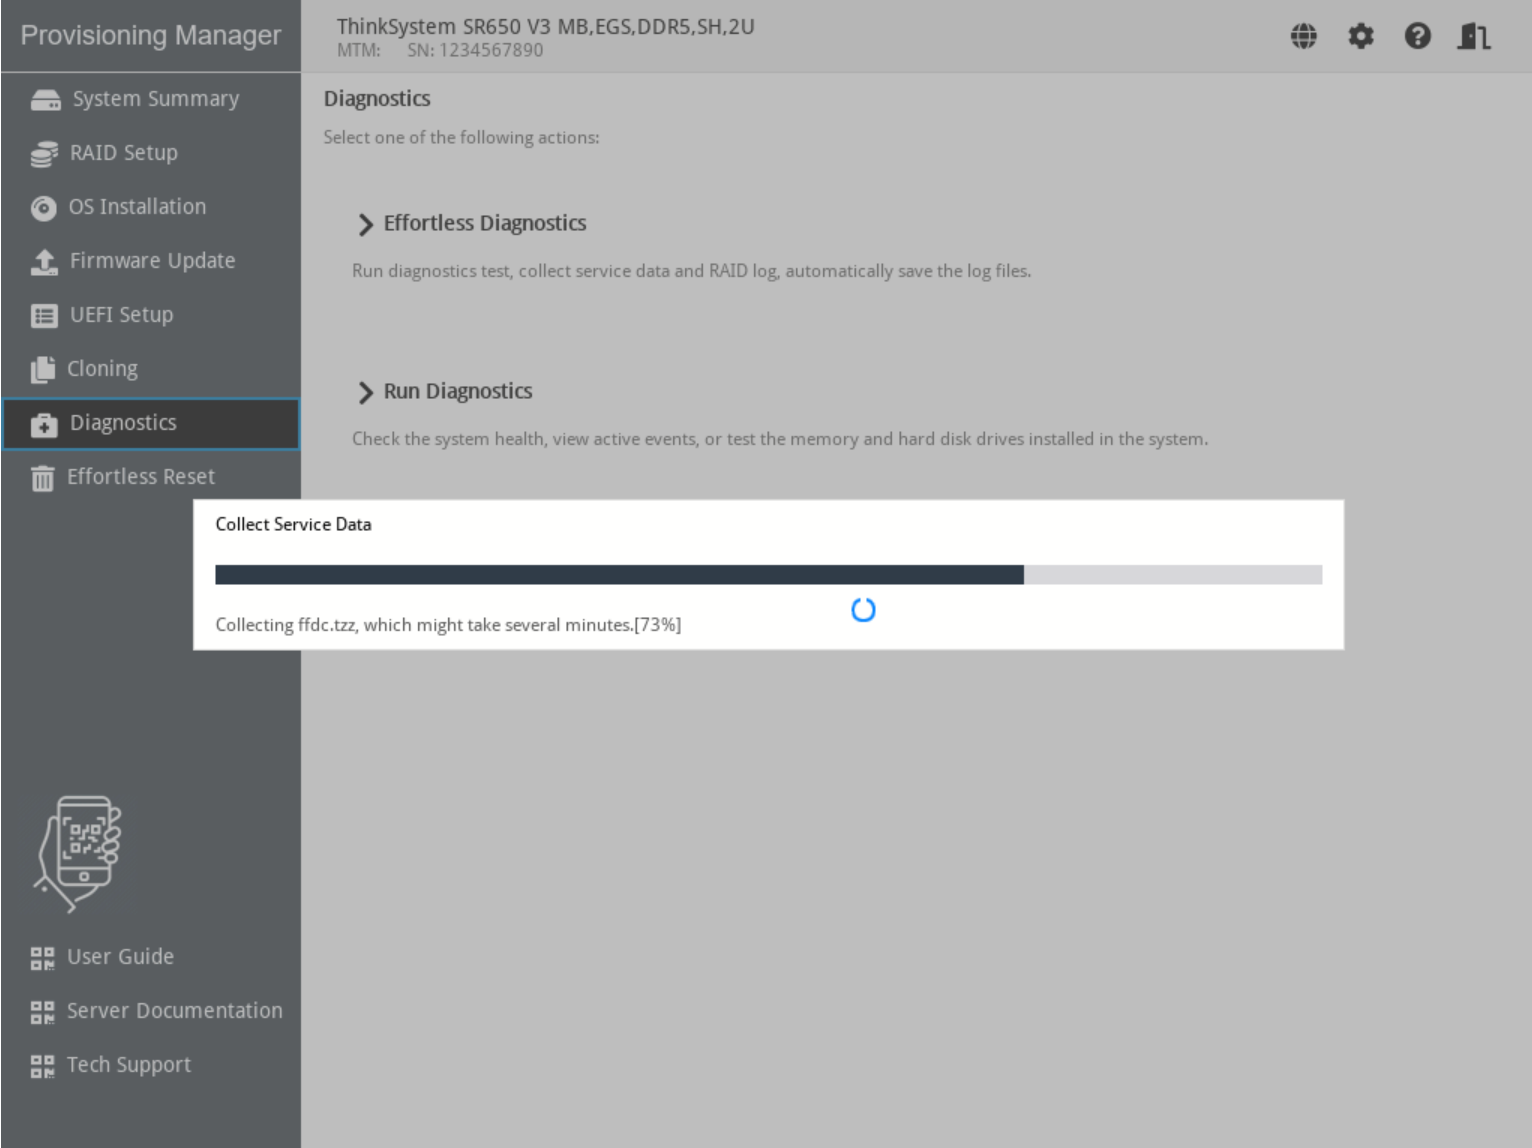
Figure 12. XClarity Provisioning Manager collect service data in progress
XClarity Provisioning Manager (LXPM) V3
XClarity Provisioning Manager V3 is an application preloaded in ThinkSystem V1 or V2 servers. It provides the essential functions to initialize a brand-new system all the way to OS installation wizard, including view hardware inventory, set date/time, BMC networking, RAID volume creation, UEFI setting and OS installation assistance, clone configuration. There are also functions for maintenance service, including collect service data, hardware diagnostics, firmware update, and system event log viewing.
XClarity Provisioning Manager can be used when physically in front of the server via a keyboard, video and mouse (KVM), or it can be accessed via XClarity Controller remote console.
Accessing the tool:
- Download: This tool is embedded in the firmware of the server.
- Documentation: https://pubs.lenovo.com/lxpm-overview/
Follow these steps to collect service data using XClarity Provisioning Manager. You will need a USB memory stick to save the service data to.
- Boot or reboot the server, wait until the POST splash screen is displayed.
- Press F1:System Setup.
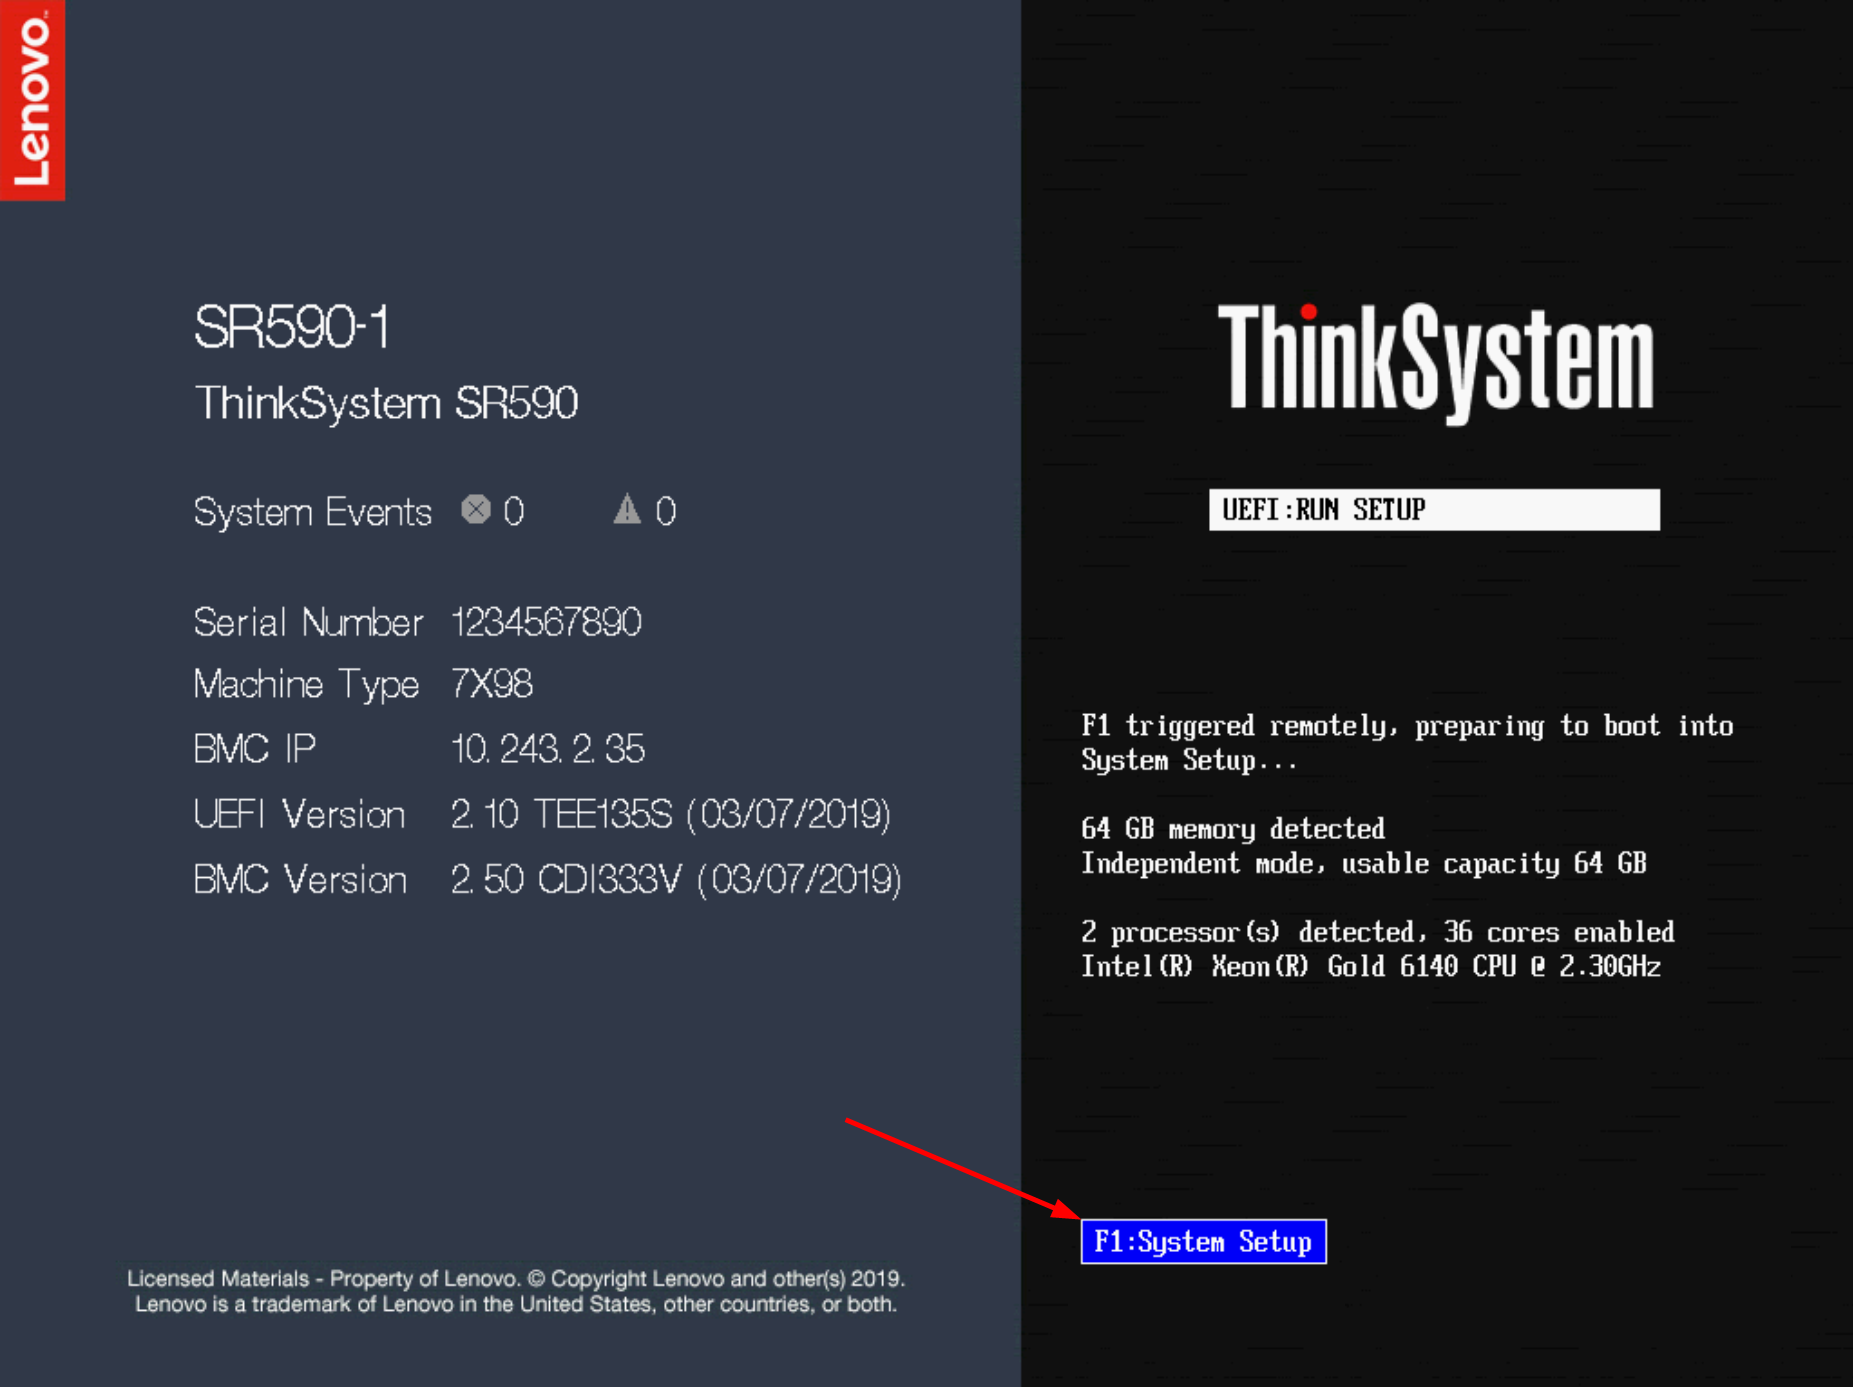
Figure 13. ThinkSystem server POST splash screen - If it shows the text mode UEFI setup, choose the option to Launch Graphical System Setup as shown in Figure 3.
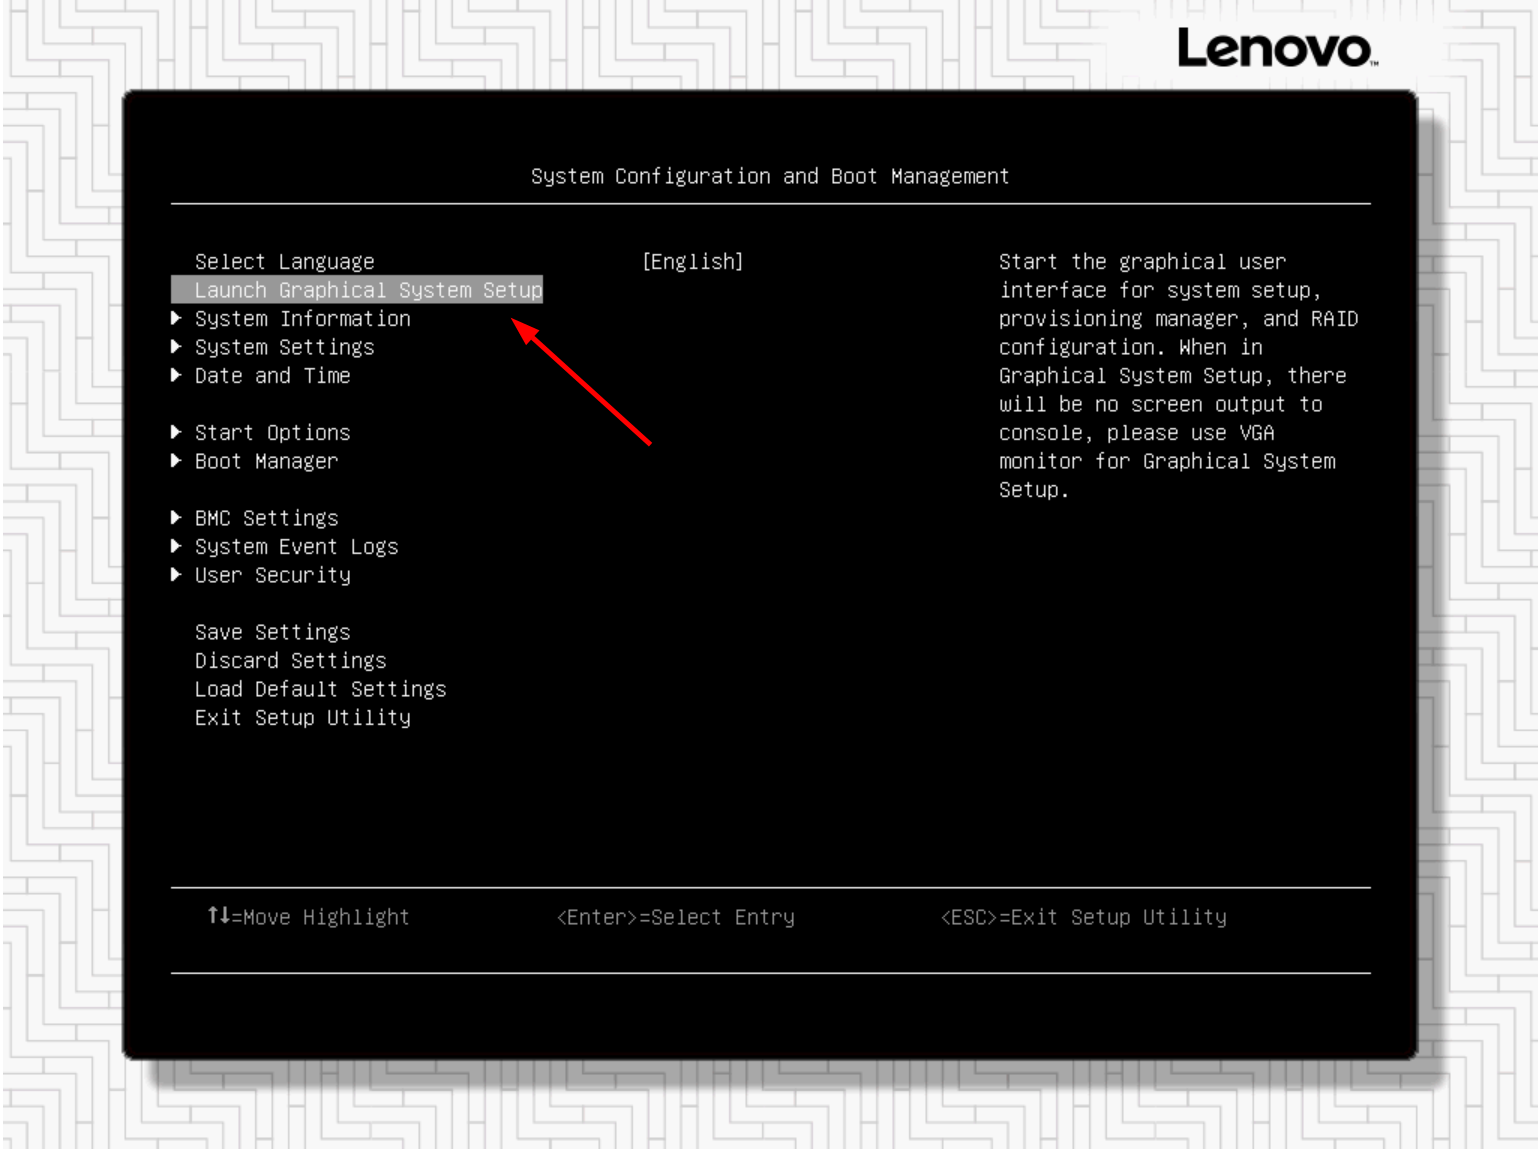
Figure 14. ThinkSystem server text mode UEFI setup utility - After launching into XClarity Provisioning Manager (LXPM), click on Diagnostics.
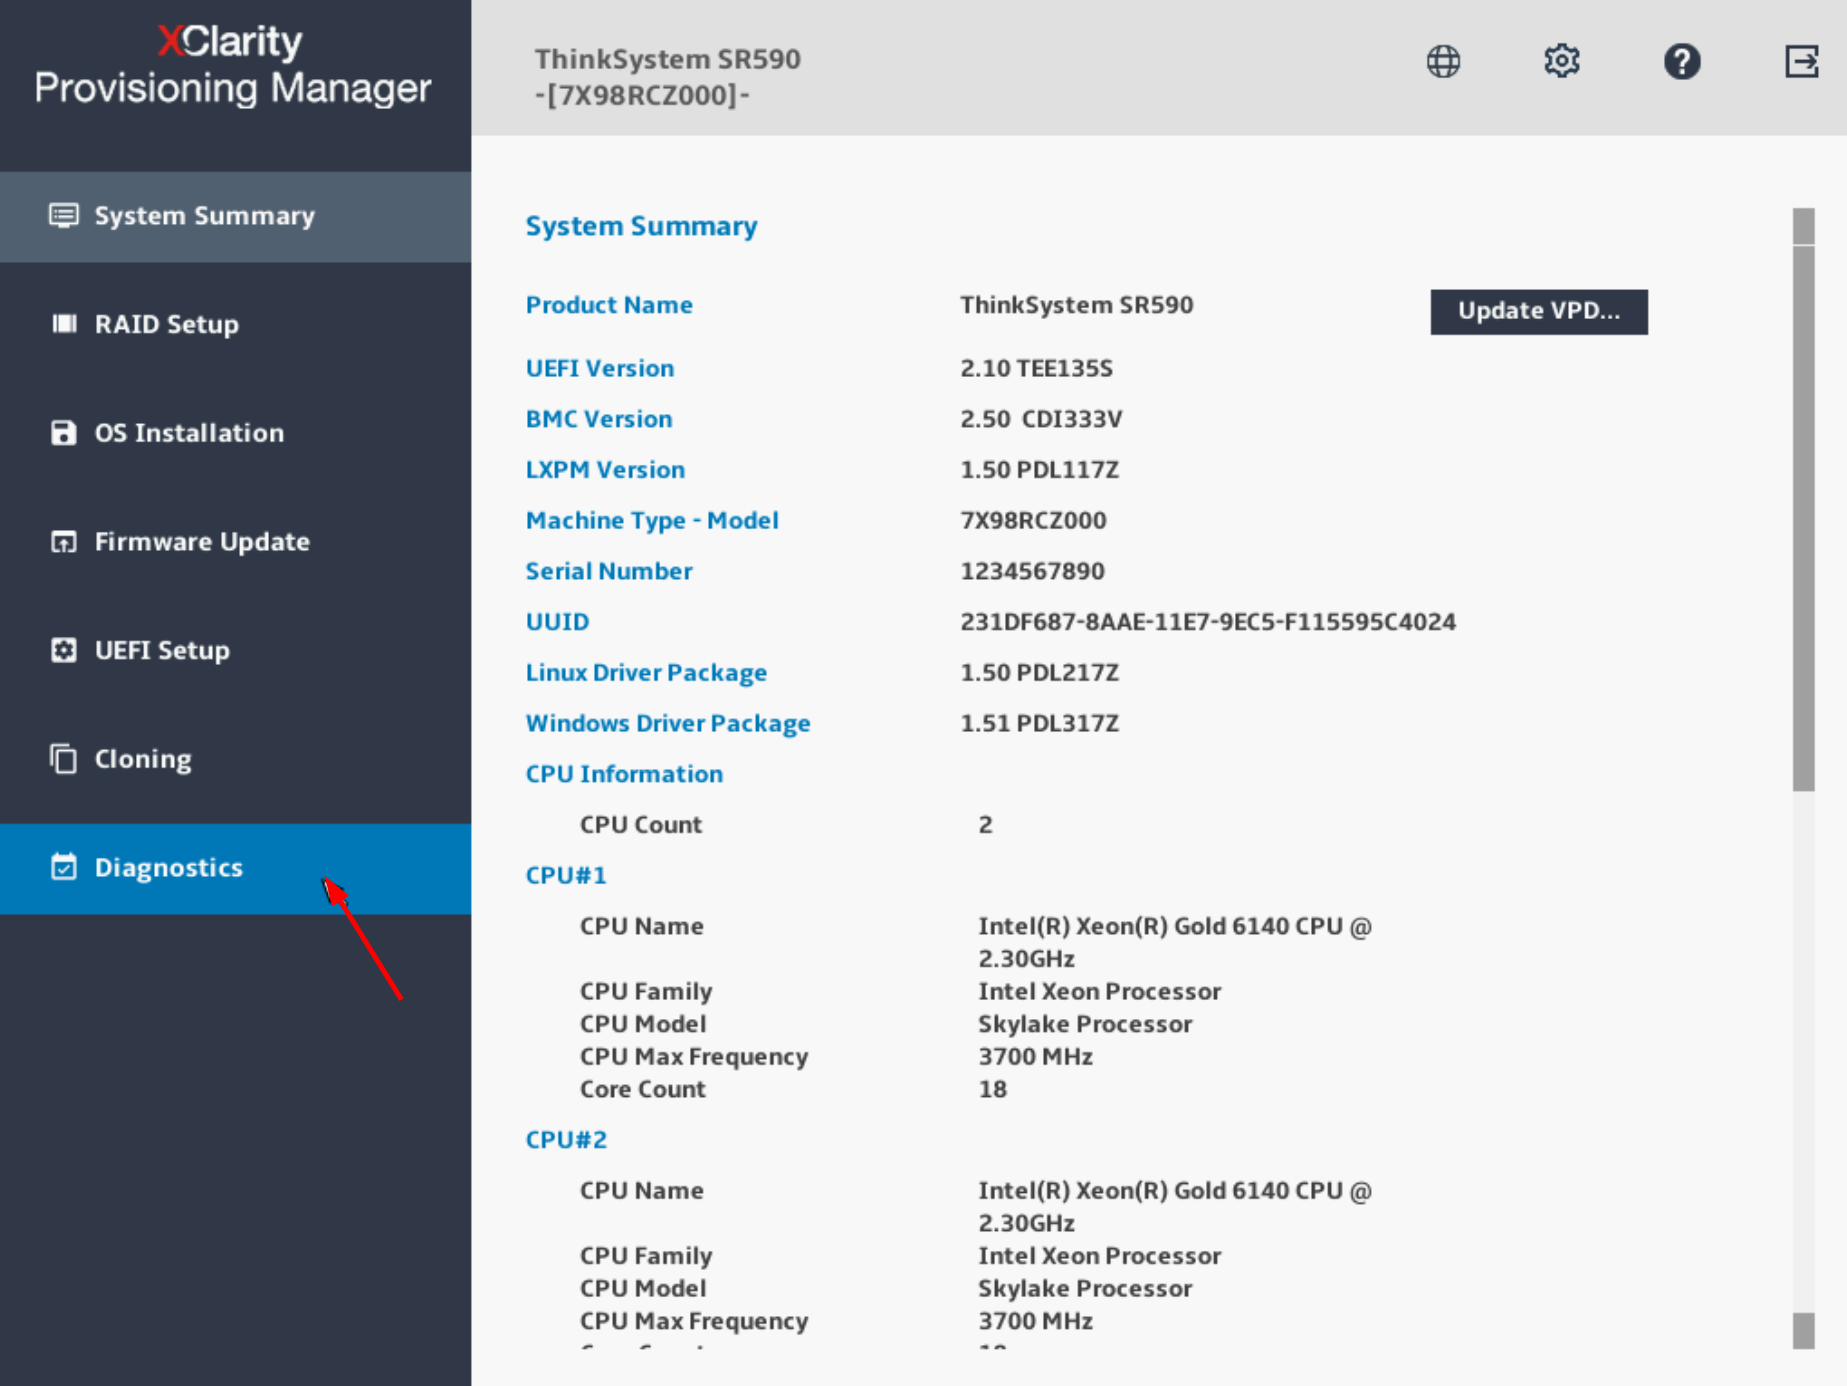
Figure 15. XClarity Provisioning Manager system summary page - Choose Collect Service Data and click on the right arrow.
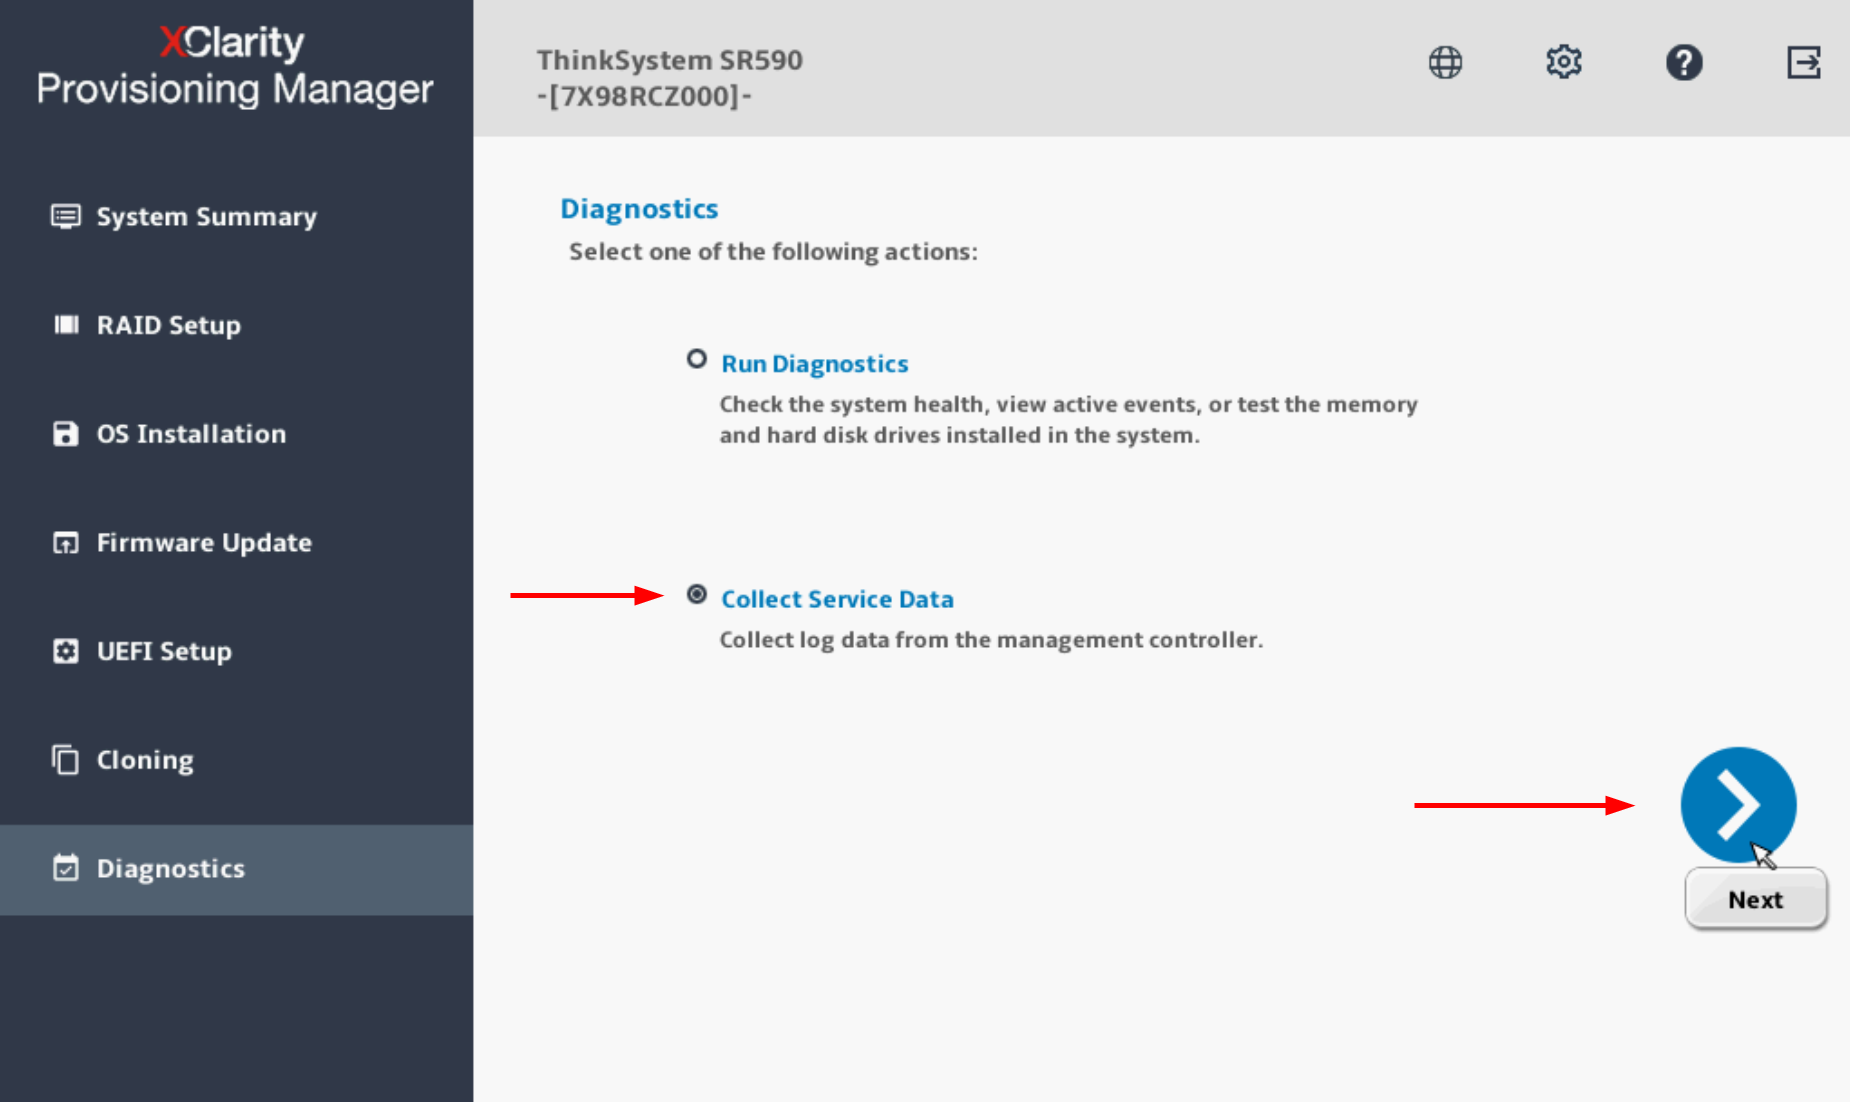
Figure 16. XClarity Provisioning Manager diagnostics page - Wait until the task is completed then click on the right arrow.
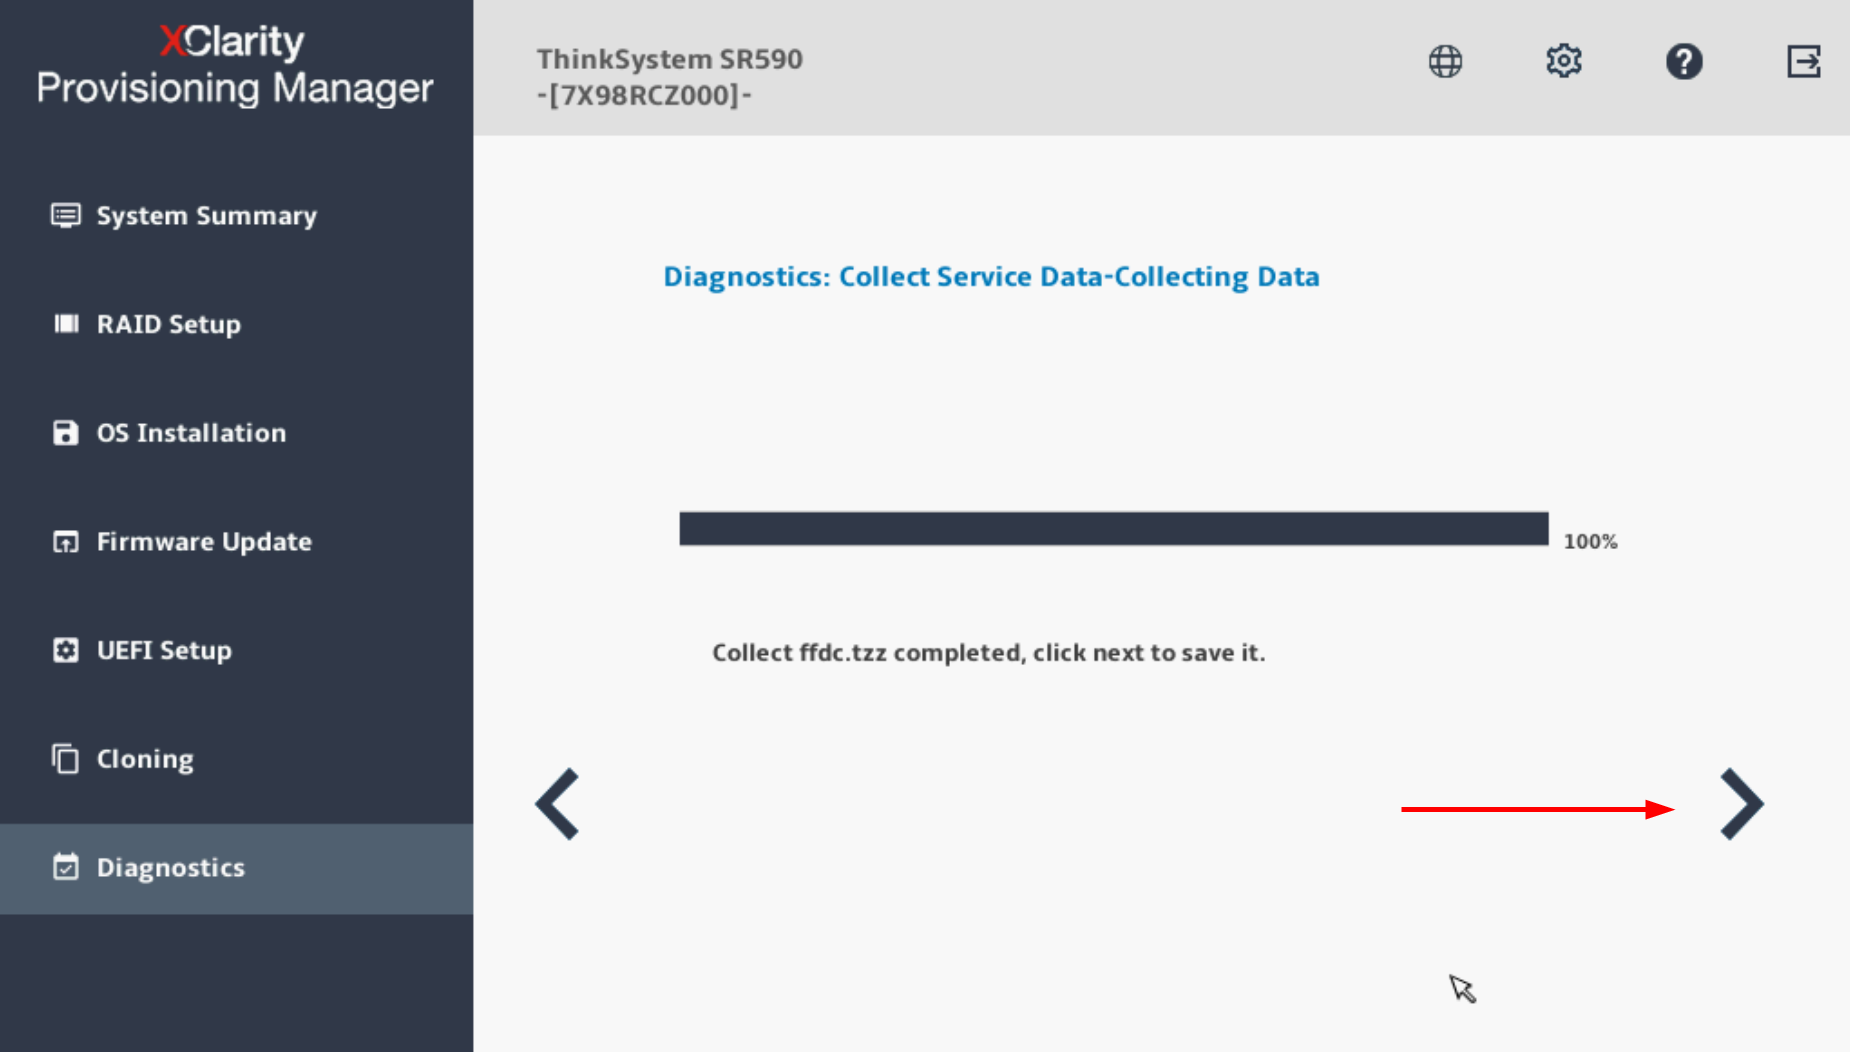
Figure 17. XClarity Provisioning Manager collecting service data - Choose a USB drive in the list; then click Save.
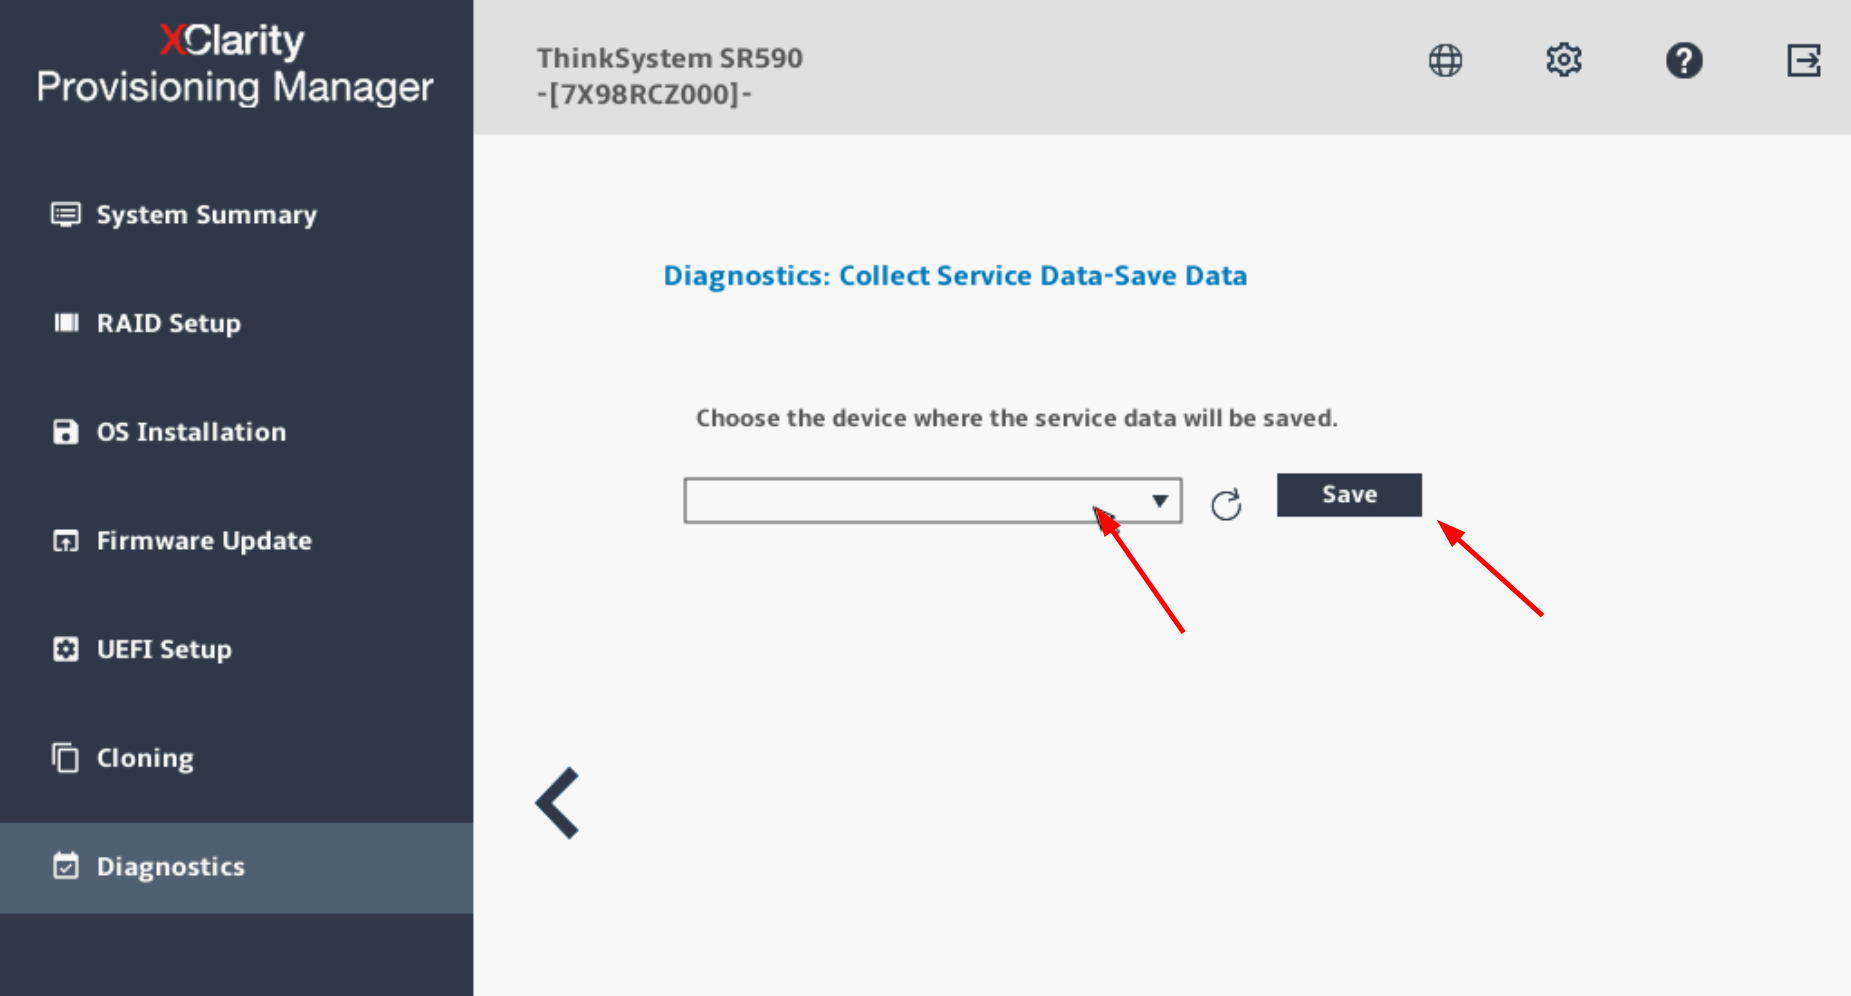
Figure 18. XClarity Provisioning Manager save service data
XClarity Administrator
XClarity Administrator provides centralized management, monitoring and provisioning of several hundreds of Lenovo devices, such as ThinkSystem servers, ThinkEdge servers, ThinkSystem storage, and ThinkSystem networking switches.
Accessing the tool:
- Download: https://datacentersupport.lenovo.com/us/en/solutions/lnvo-lxcaupd
- Documentation: https://pubs.lenovo.com/lxca/
Use the following steps to collect service data using XClarity Administrator :
- Log in to the XClarity Administrator management interface.
- Click on the menu Administration > Service and Support, then on the Endpoint Actions.
- Select one or more endpoints on which you’d like to collect service logs, then click the menu All Actions > Collect Service Data, confirm the action when prompted.
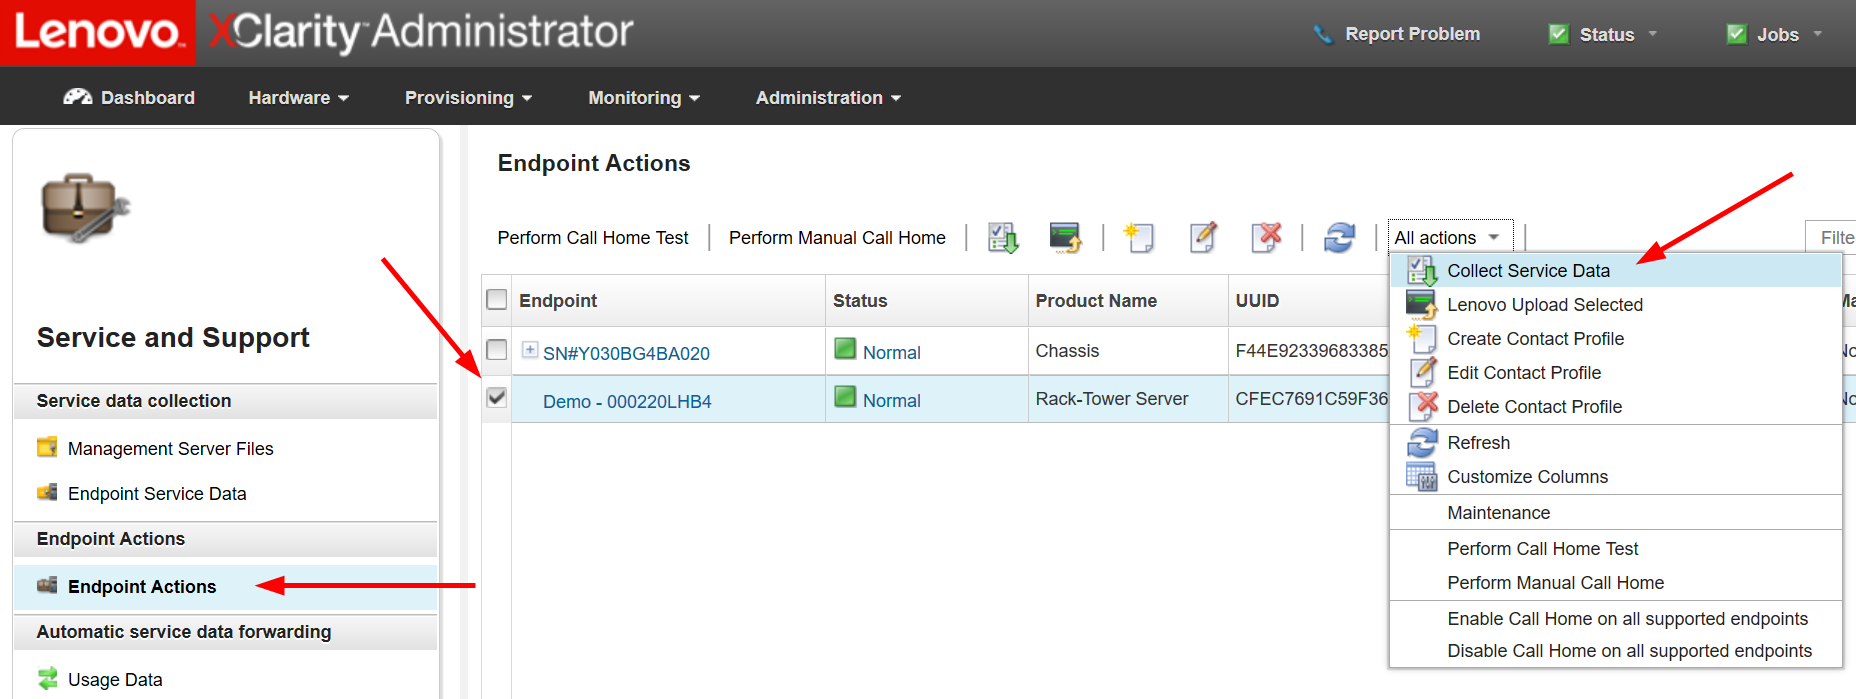
Figure 19. XClarity Administrator endpoint actions - The task will be launched in the background and should take a few minutes to complete.
- To download the service data file to your workstation, navigate to Endpoint Service Data.
- Select a file then click on the toolbar button or the equivalent menu in All Actions > Download Selected Service Files.
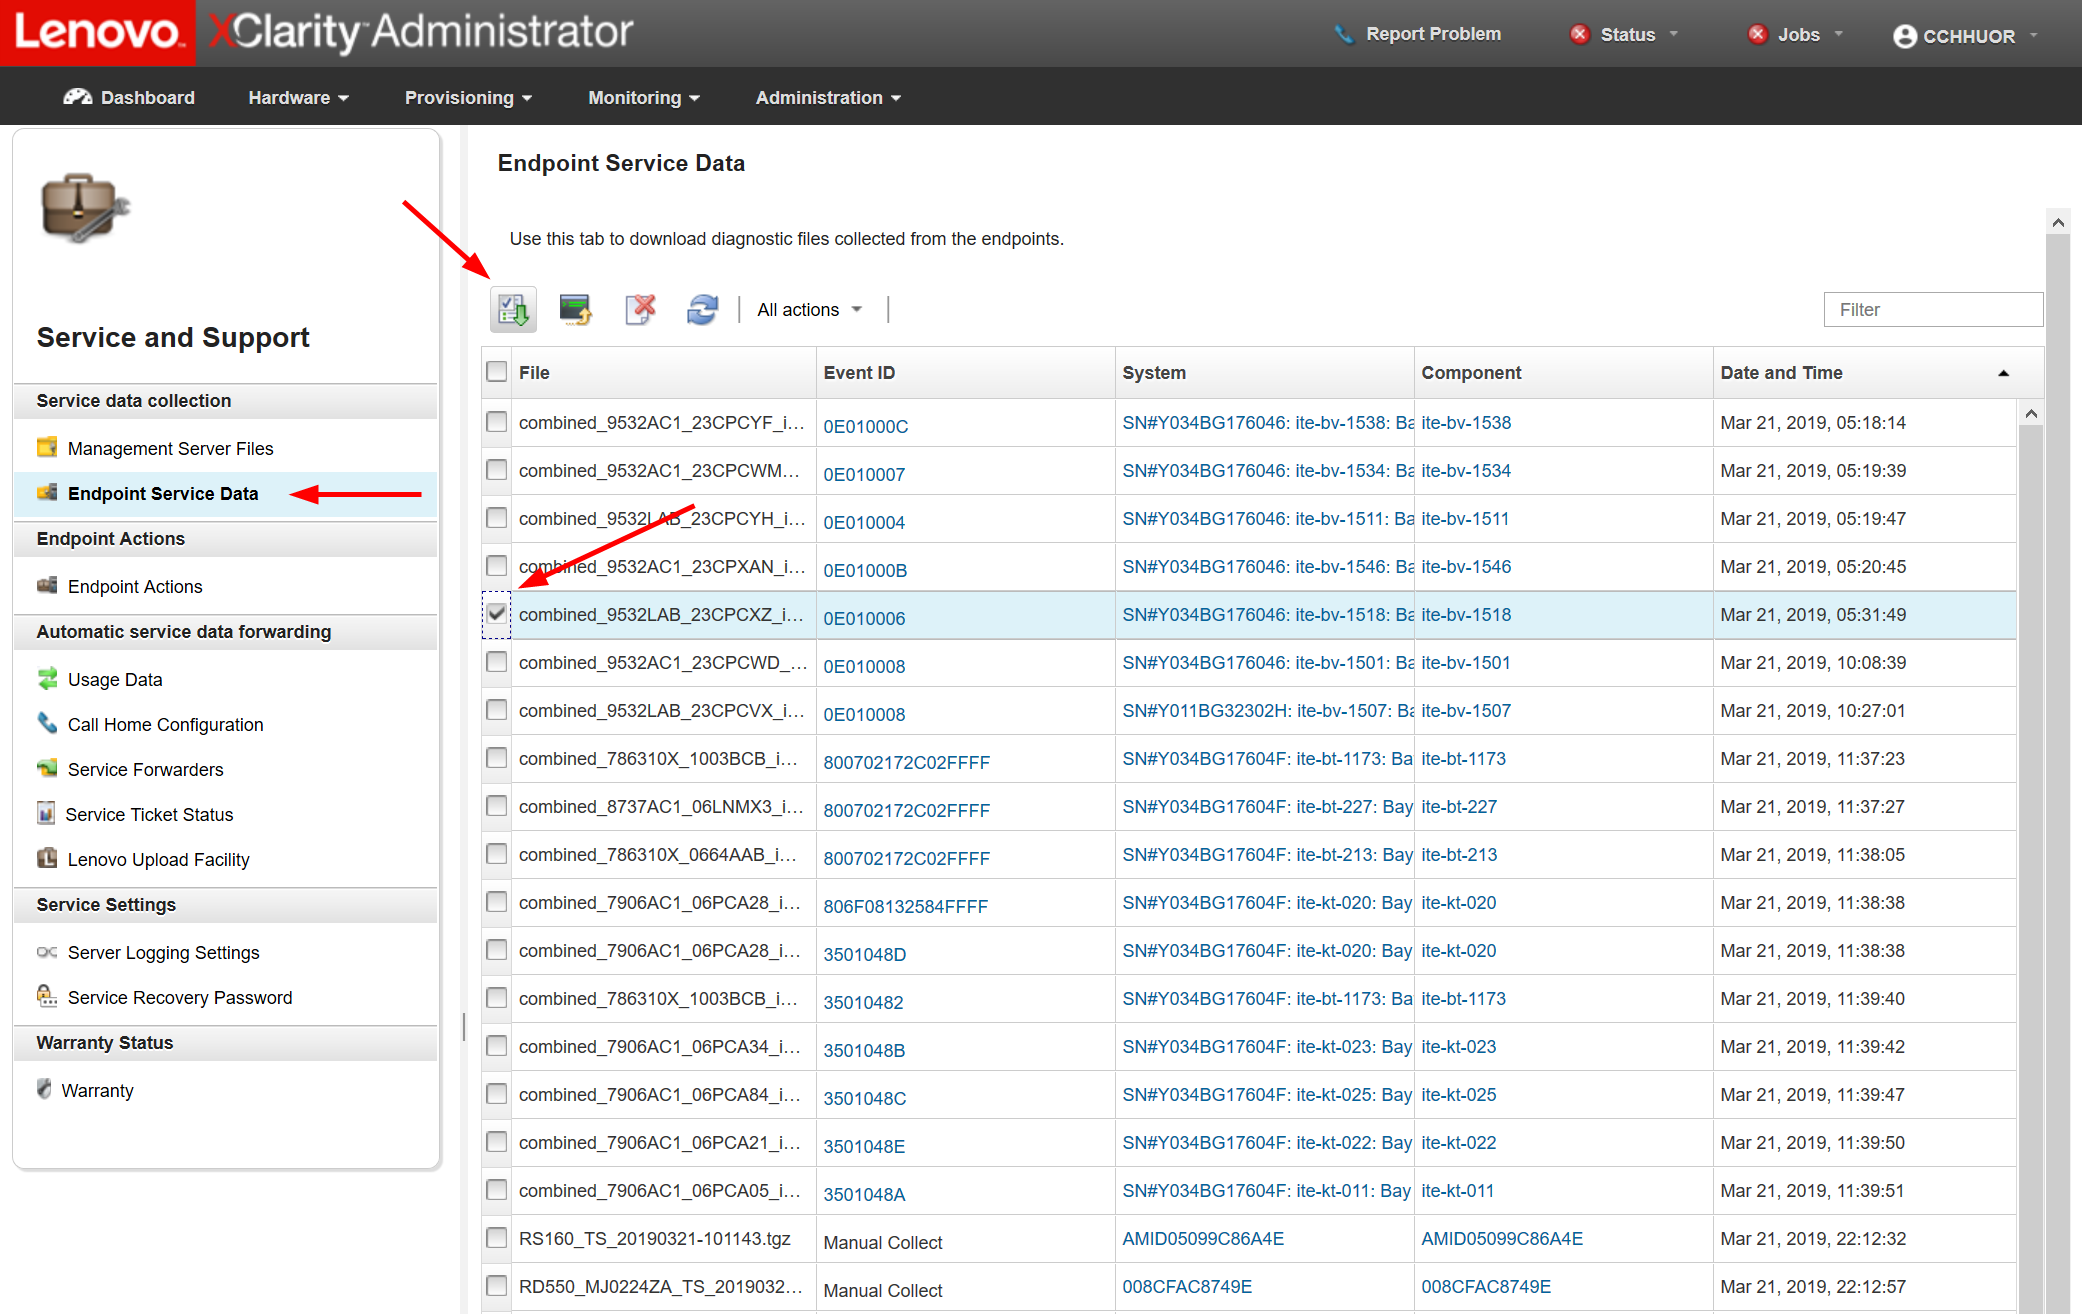
Figure 20. XClarity Administrator endpoint service data - With XClarity Administrator V4.0 or higher, there would be a new File Type column displayed, the zip file type is the new service data log while the tzz file type is the debug log.
XClarity Orchestrator
XClarity Orchestrator provides federated management of several XClarity Administrator instances for large environments that have tens of thousands of managed devices. It also provides advanced analytics for data visualization and failure prediction.
Accessing the tool:
- Download: https://datacentersupport.lenovo.com/us/en/solutions/lnvo-lxco
- Documentation: https://pubs.lenovo.com/lxco/
Use the following steps to collect service data using XClarity Orchestrator:
- Log in to the XClarity Orchestrator management interface.
- Click on the menu Administration > Service and Support, then on the Device Actions.
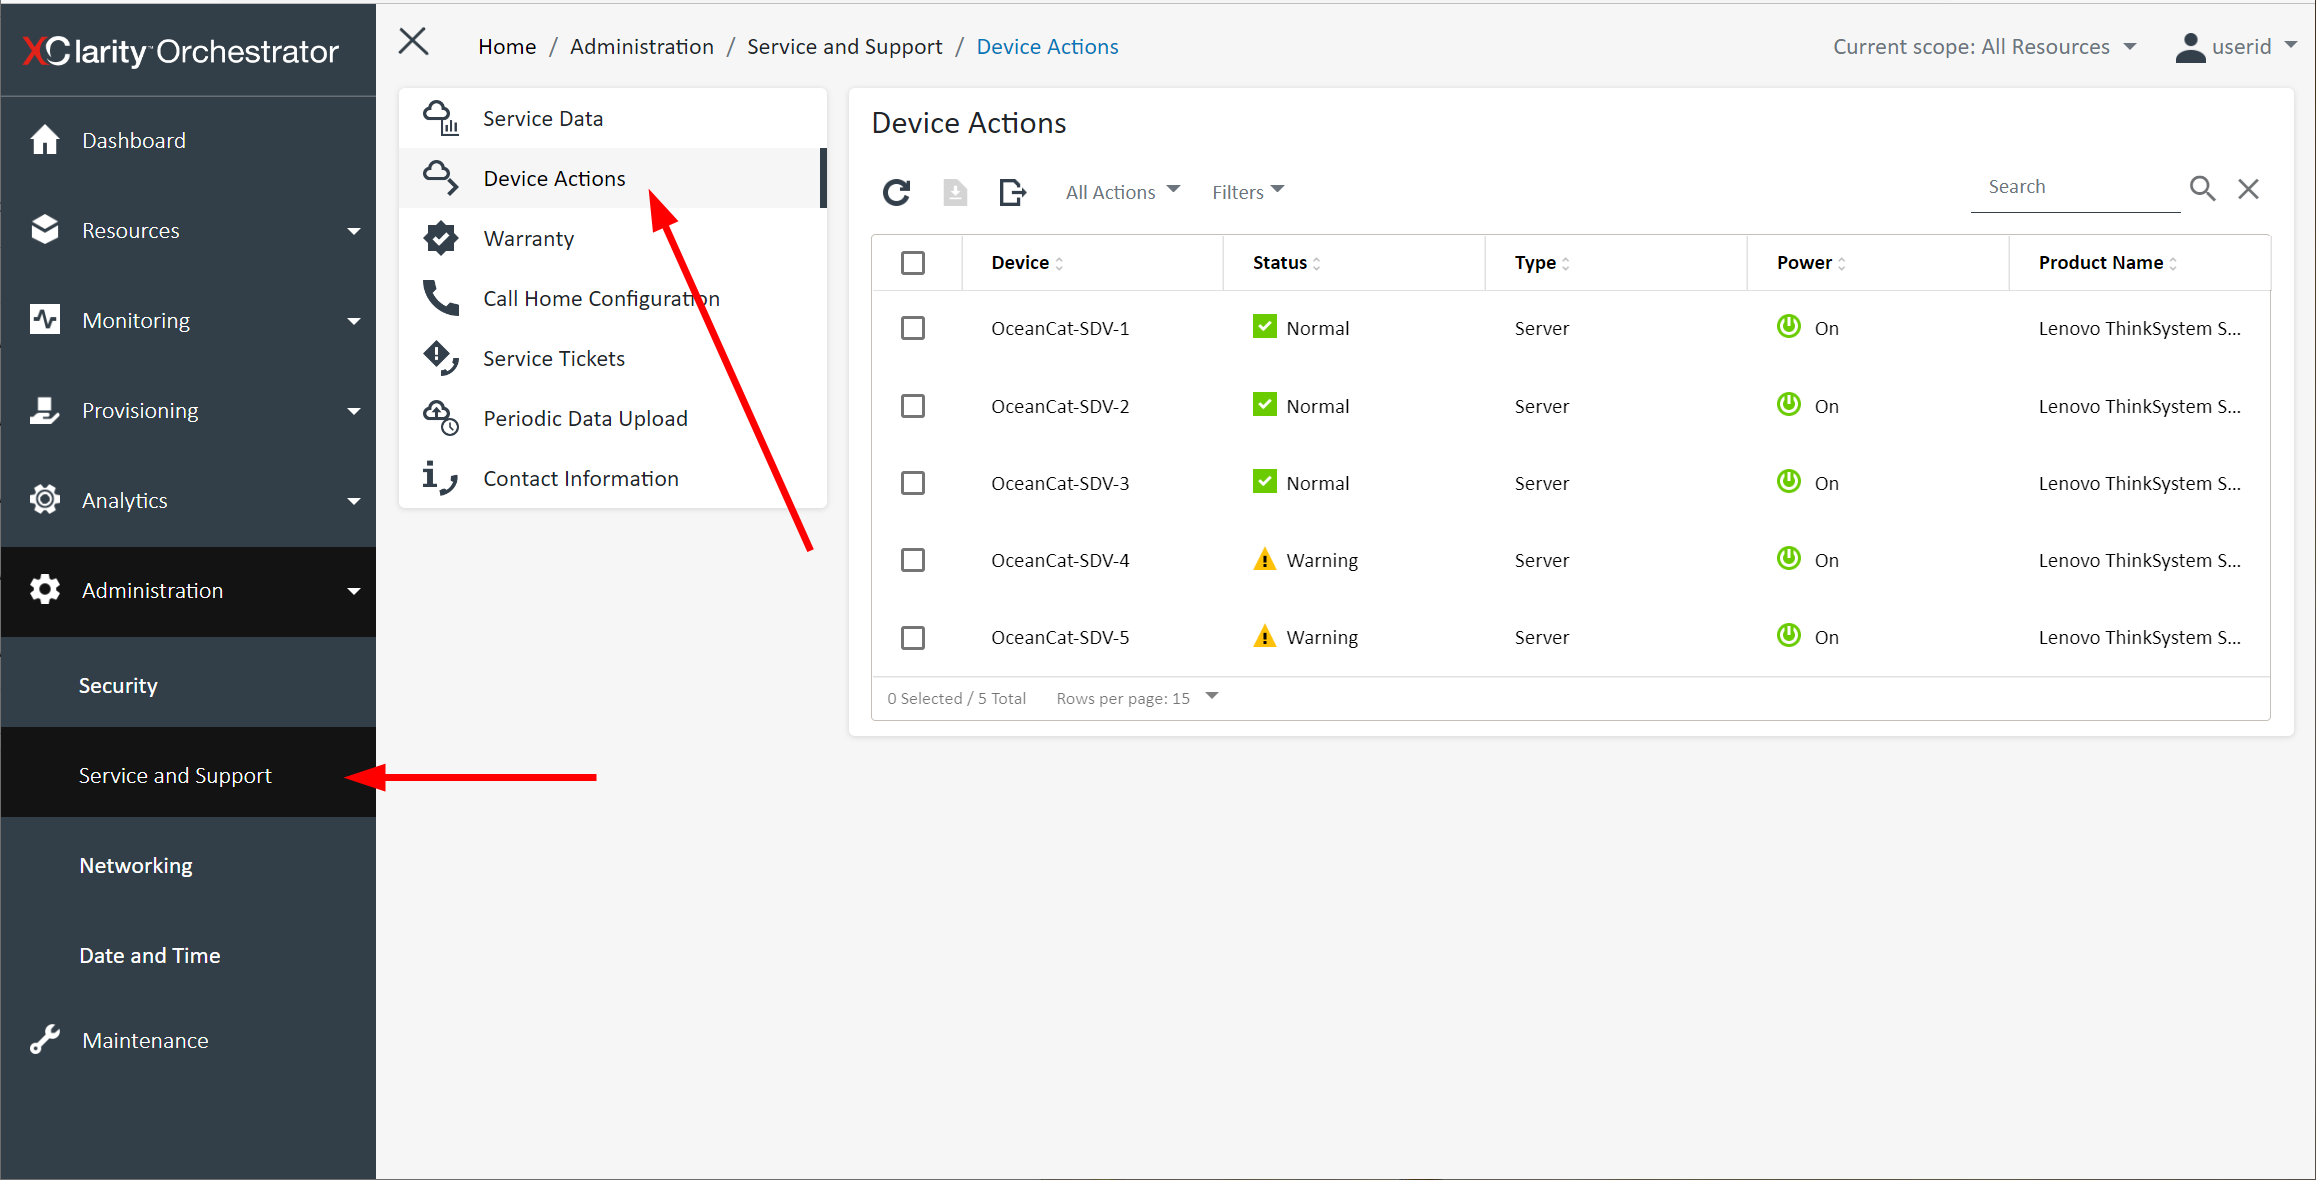
Figure 21. XClarity Orchestrator Device Actions page - Select one or more devices on which you’d like to collect service logs, then click the toolbar button or the equivalent menu All Actions > Collect Service Data.
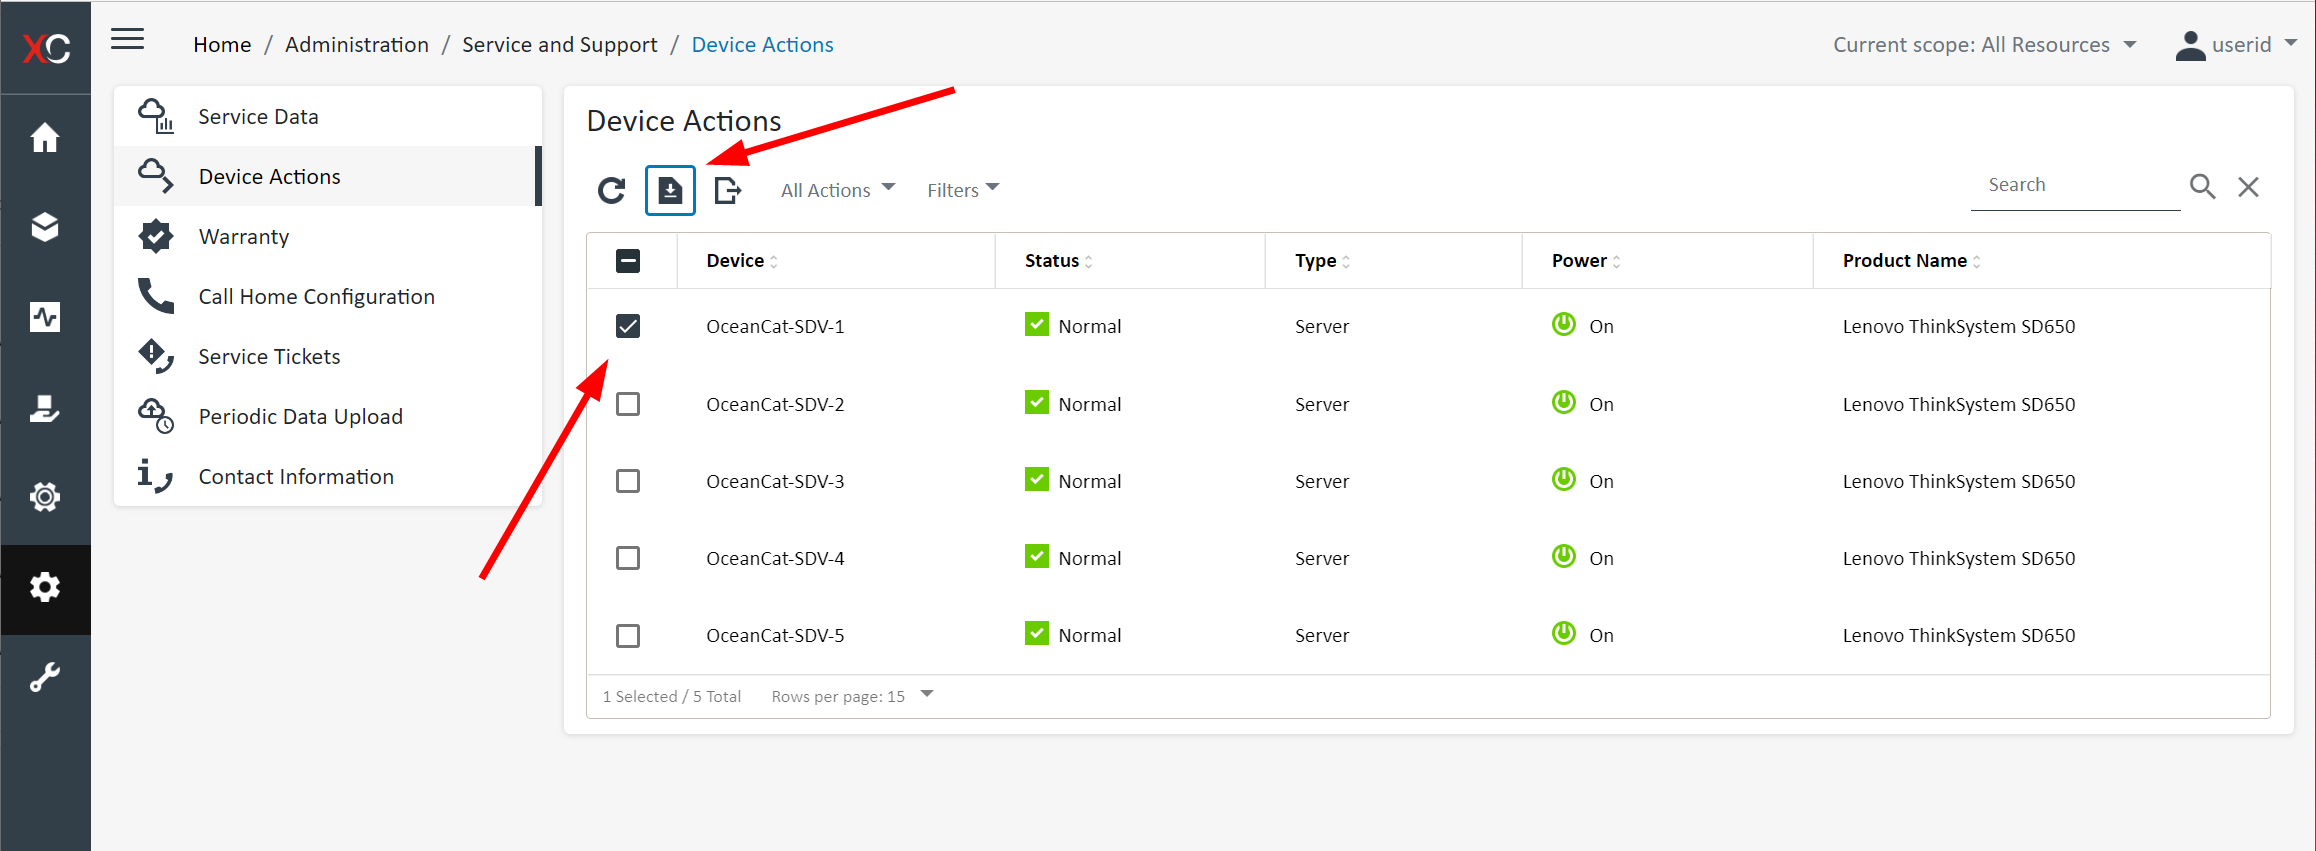
Figure 22. XClarity Orchestrator collect service data action - To download the service data file to your workstation, go to Service Data.
- Select a file then click on the toolbar button or the equivalent menu All Actions > Save service files.
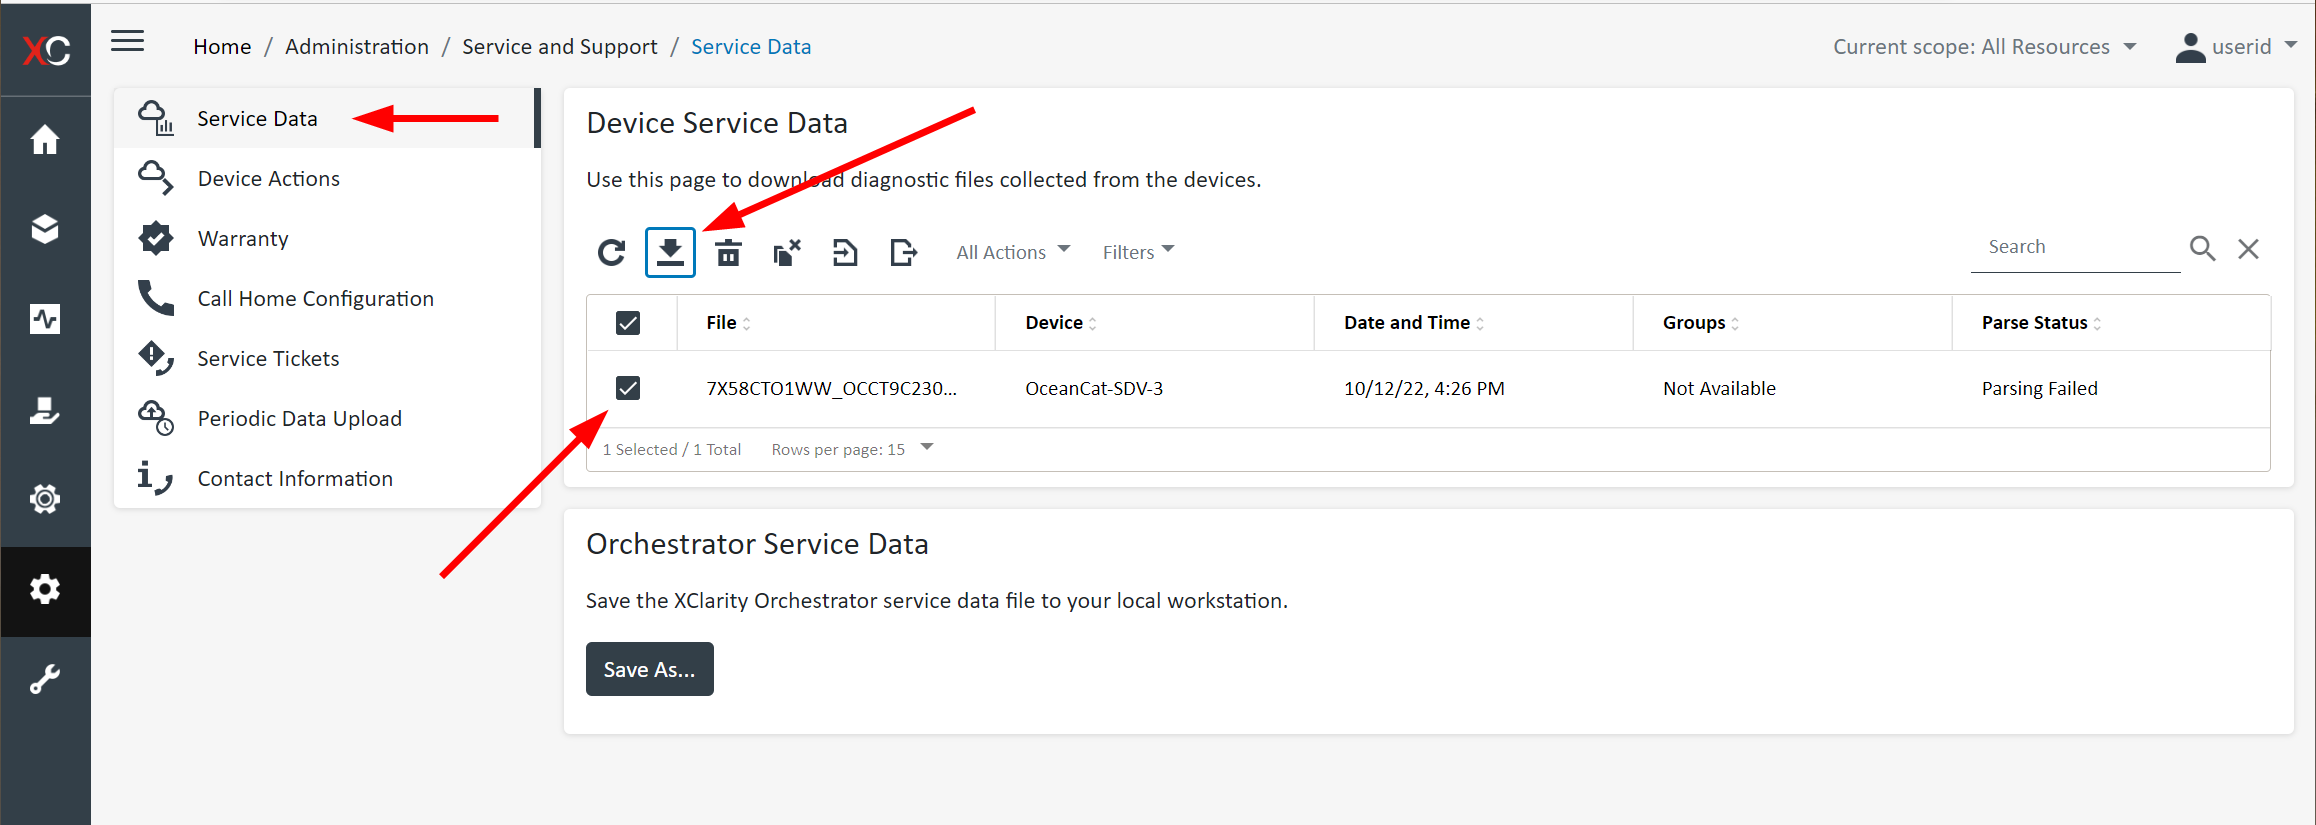
Figure 23. XClarity Orchestrator Device Service Data page
XClarity Integrator for Windows Admin Center
XClarity Integrator provides centralized management and monitoring of ThinkSystem servers running on Microsoft Windows Server. It provides additional hardware visibility that complement the software platform, including better hardware inventory, events and alerting, and collect service data.
Accessing the tool:
- Download: https://datacentersupport.lenovo.com/us/en/solutions/lnvo-lxci-wac
- Documentation: https://pubs.lenovo.com/lxci-wac/
Use the following steps to collect service data using XClarity Integrator for Windows Admin Center:
- Login to the Windows Admin Center then choose the Server Manager view and pick the server that you’d like to collect service logs.
- At the left navigation tree, look for Lenovo XClarity Integrator under Extensions.
- Inside the XClarity Integrator page, navigate to Service Data page.
- Now you can click on the Collect Service Data button to trigger the action.
- Or you may select a file that was previously collected and click on Download Files to transfer it to your local workstation.

Figure 24. XClarity Integrator for Windows Admin Center
XClarity Mobile app
The XClarity Mobile app can be used as a client to XClarity Administrator server. It can view all the managed devices status and inventory, receive alerts, take power actions, and collect service data.
The XClarity Mobile app can also be used in standalone mode connecting directly to the server via the management USB port. It provides direct access to XClarity Controller to view hardware inventory, setup BMC networking, take power actions and collect service data.
Accessing the tool:
- From the phone’s app store: search for “XClarity Mobile” or use the following links:
- Documentation: https://pubs.lenovo.com/lxca/lxca_usemobileapp.html
Using the Mobile app as client to XClarity Administrator
Instruction for the mobile app acting as client to XClarity Administrator:
- Connect to the XClarity Administrator then go to the Hardware
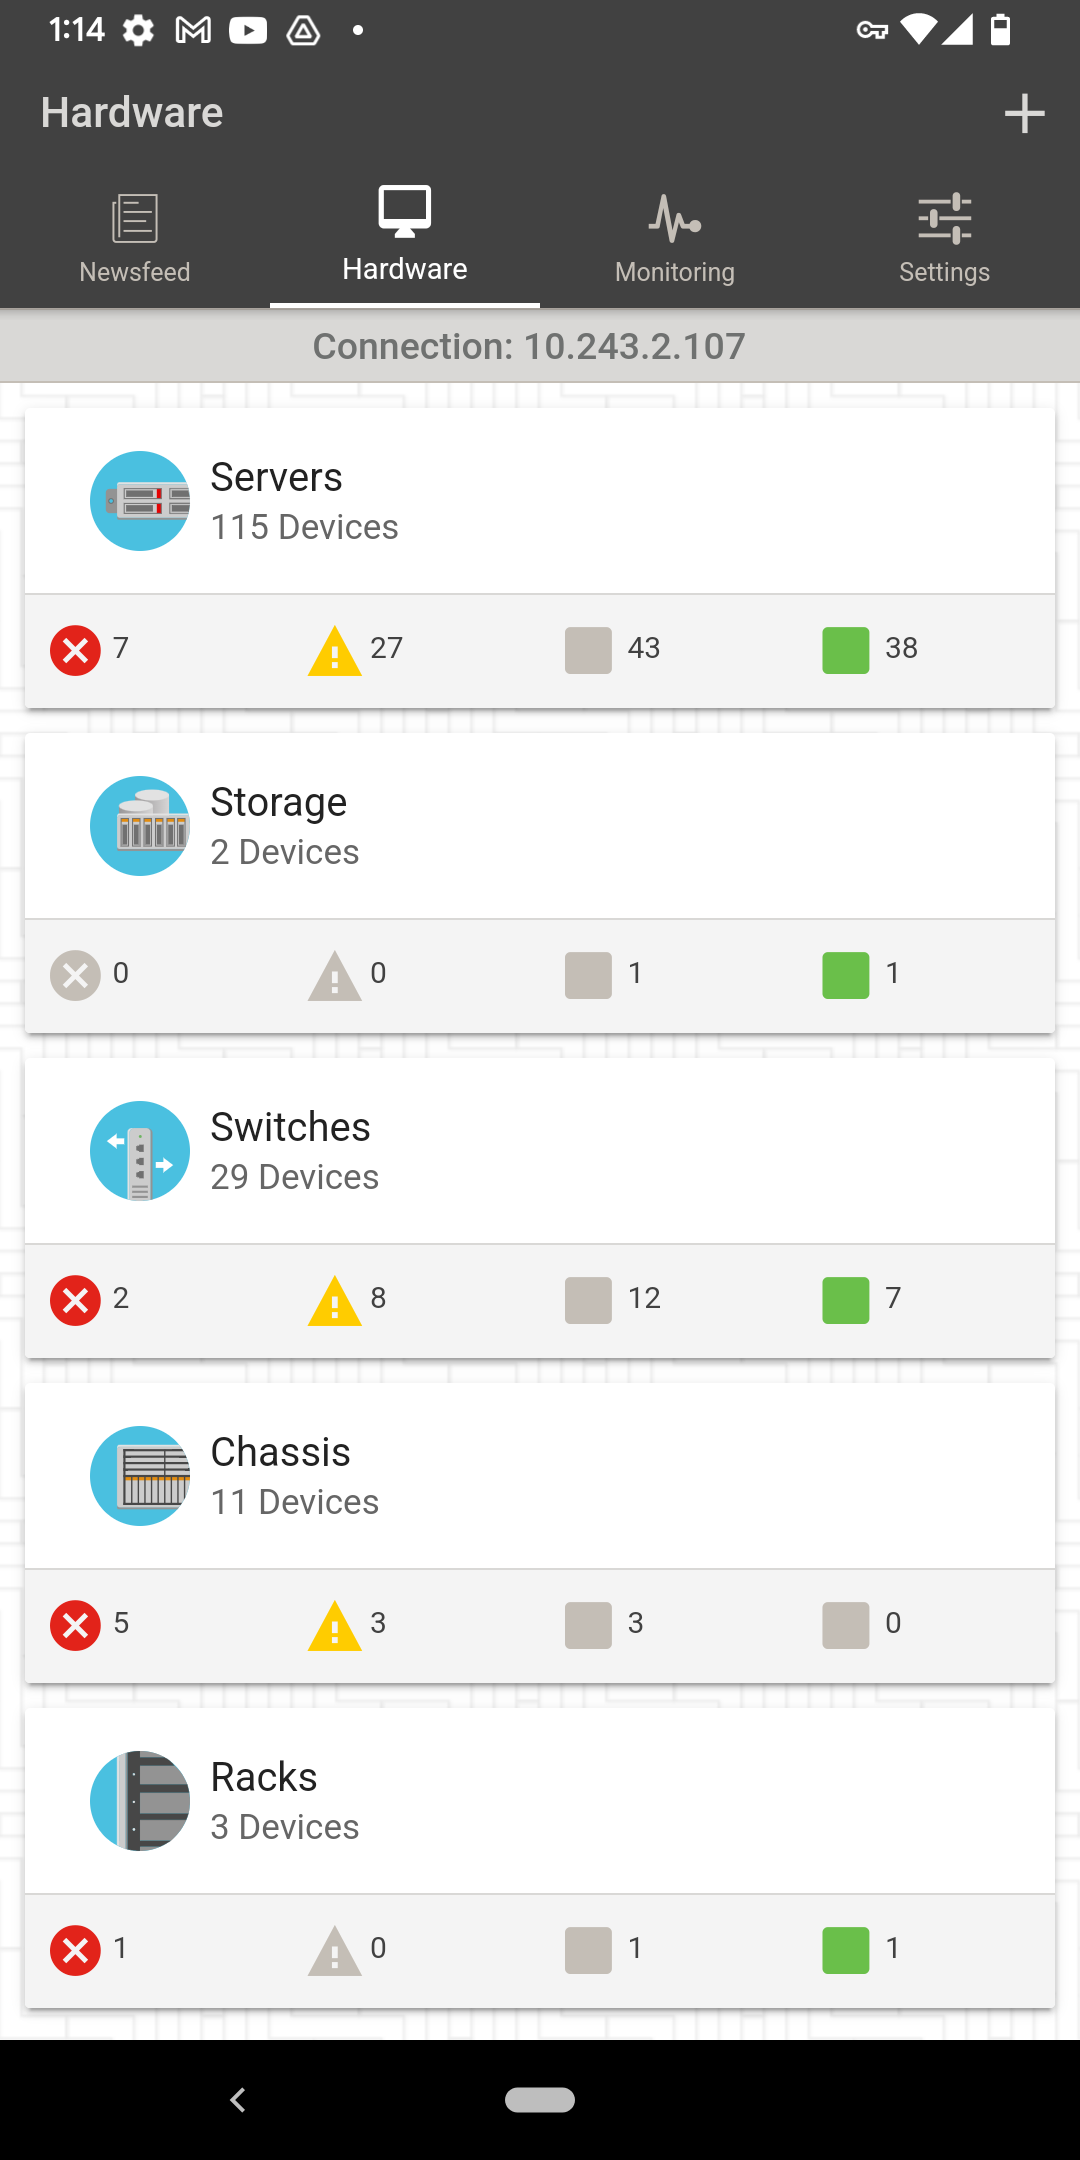
Figure 25. XClarity Mobile app Hardware tab - Select the target server, then open the top right options menu (3 vertical dots icon), select Service options in the menu.
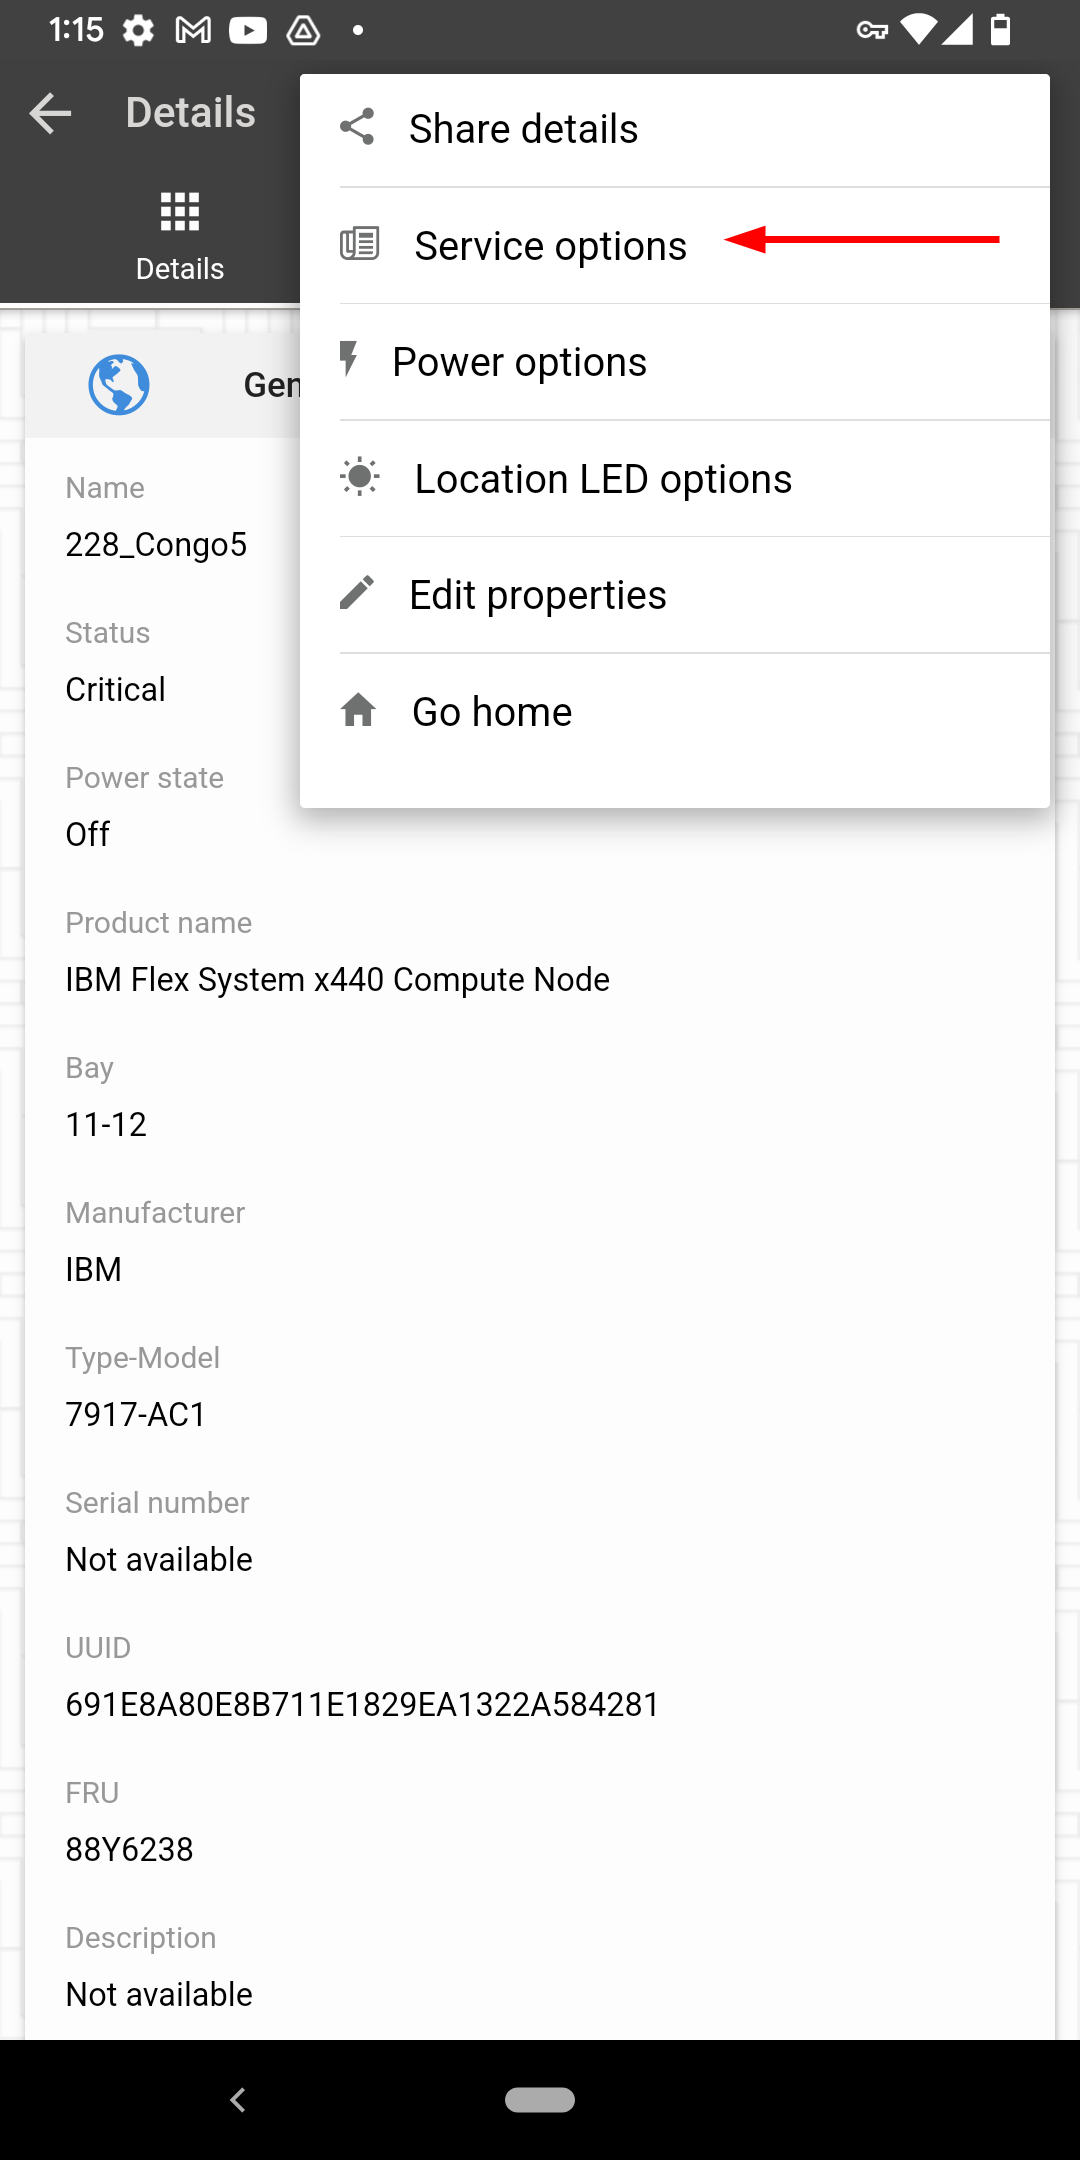
Figure 26. XClarity Mobile app server options menu - Finally, select Collect service data.
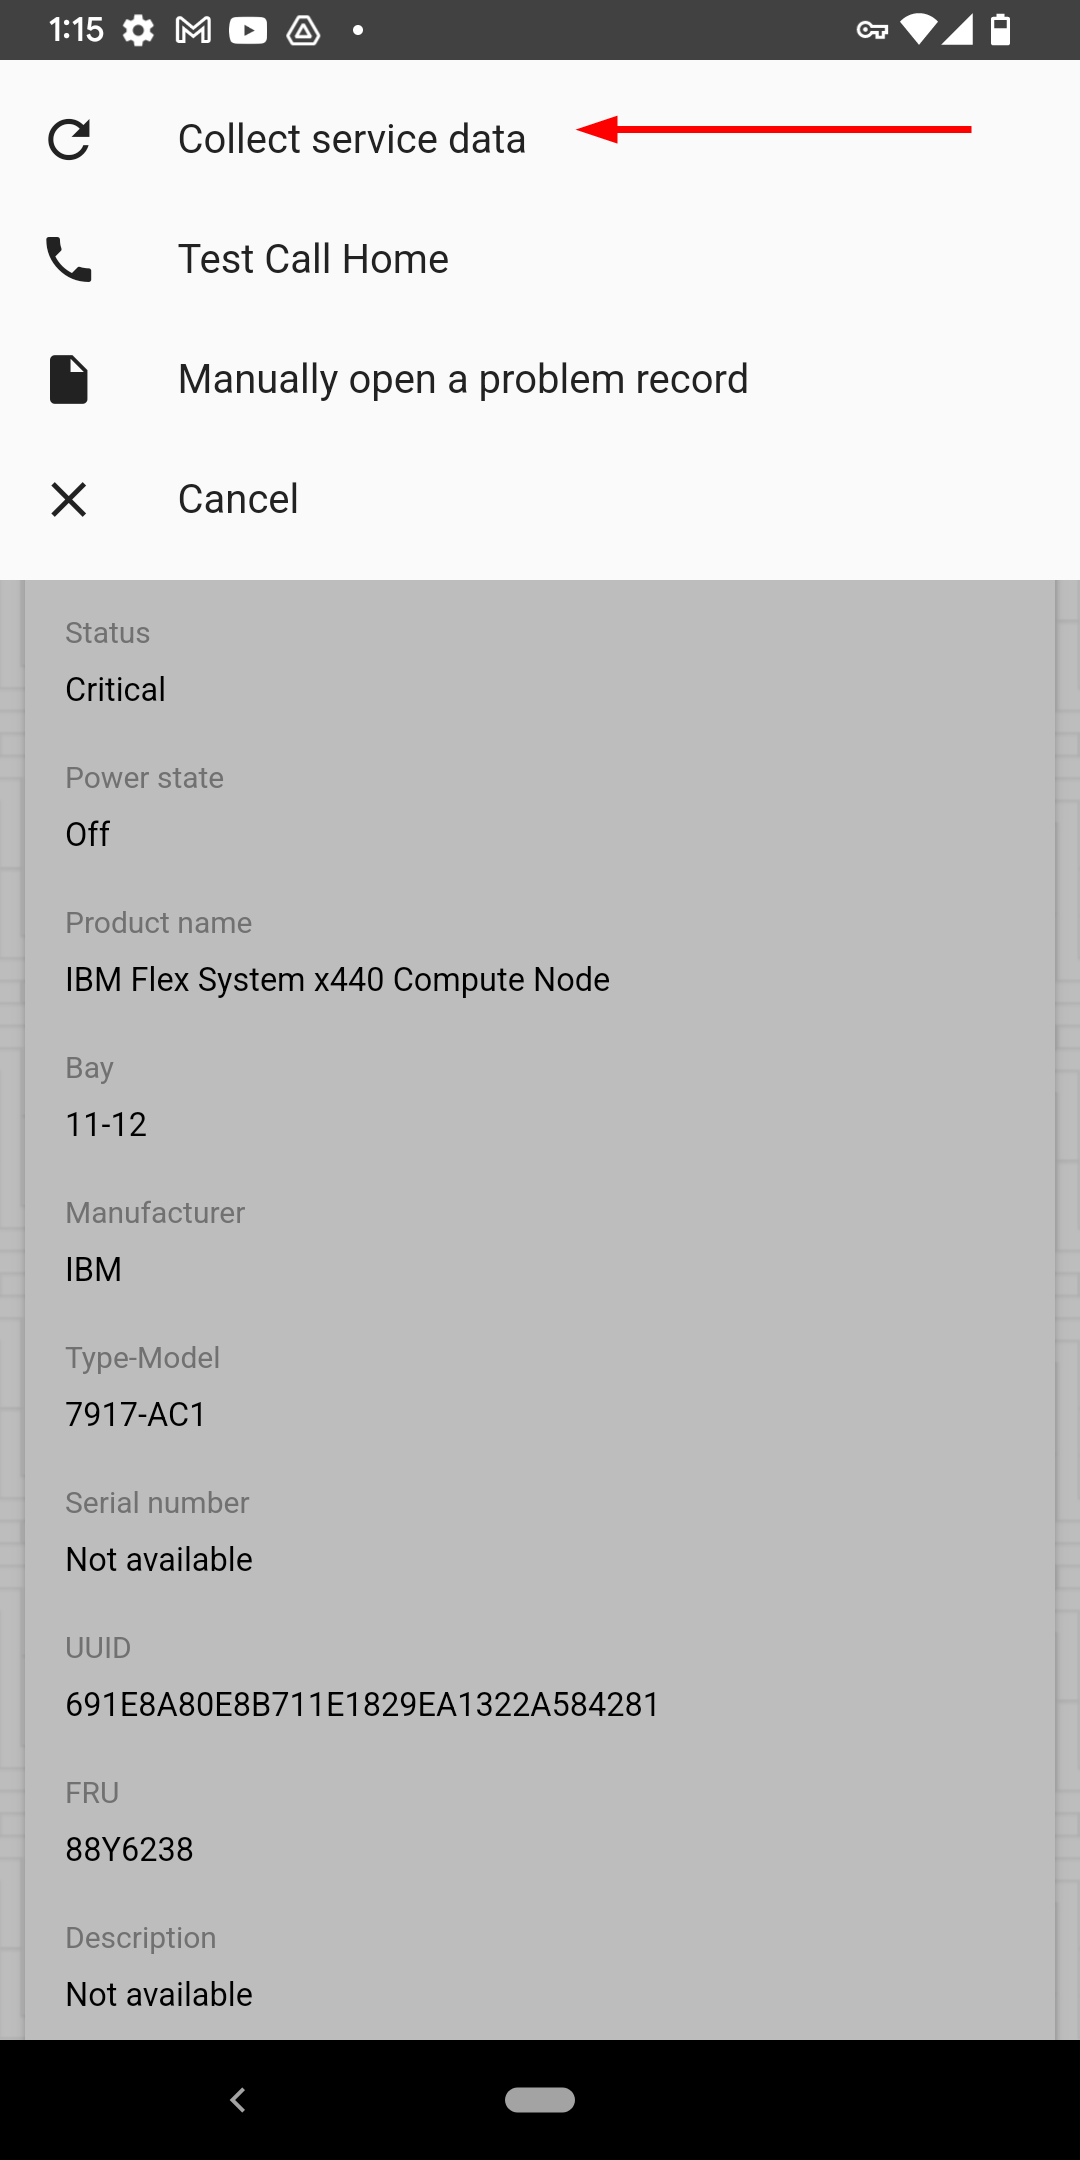
Figure 27. XClarity Mobile app Service options menu - The debug data file will be collected and stored on XClarity Administrator, follow the instruction in the XClarity Administrator section to download the data file to your workstation if you need it.
Using the mobile app to connect to the server via USB
Instruction for the mobile app connecting directly to the server via USB:
- Launch the app, then click on the USB icon at the upper right.
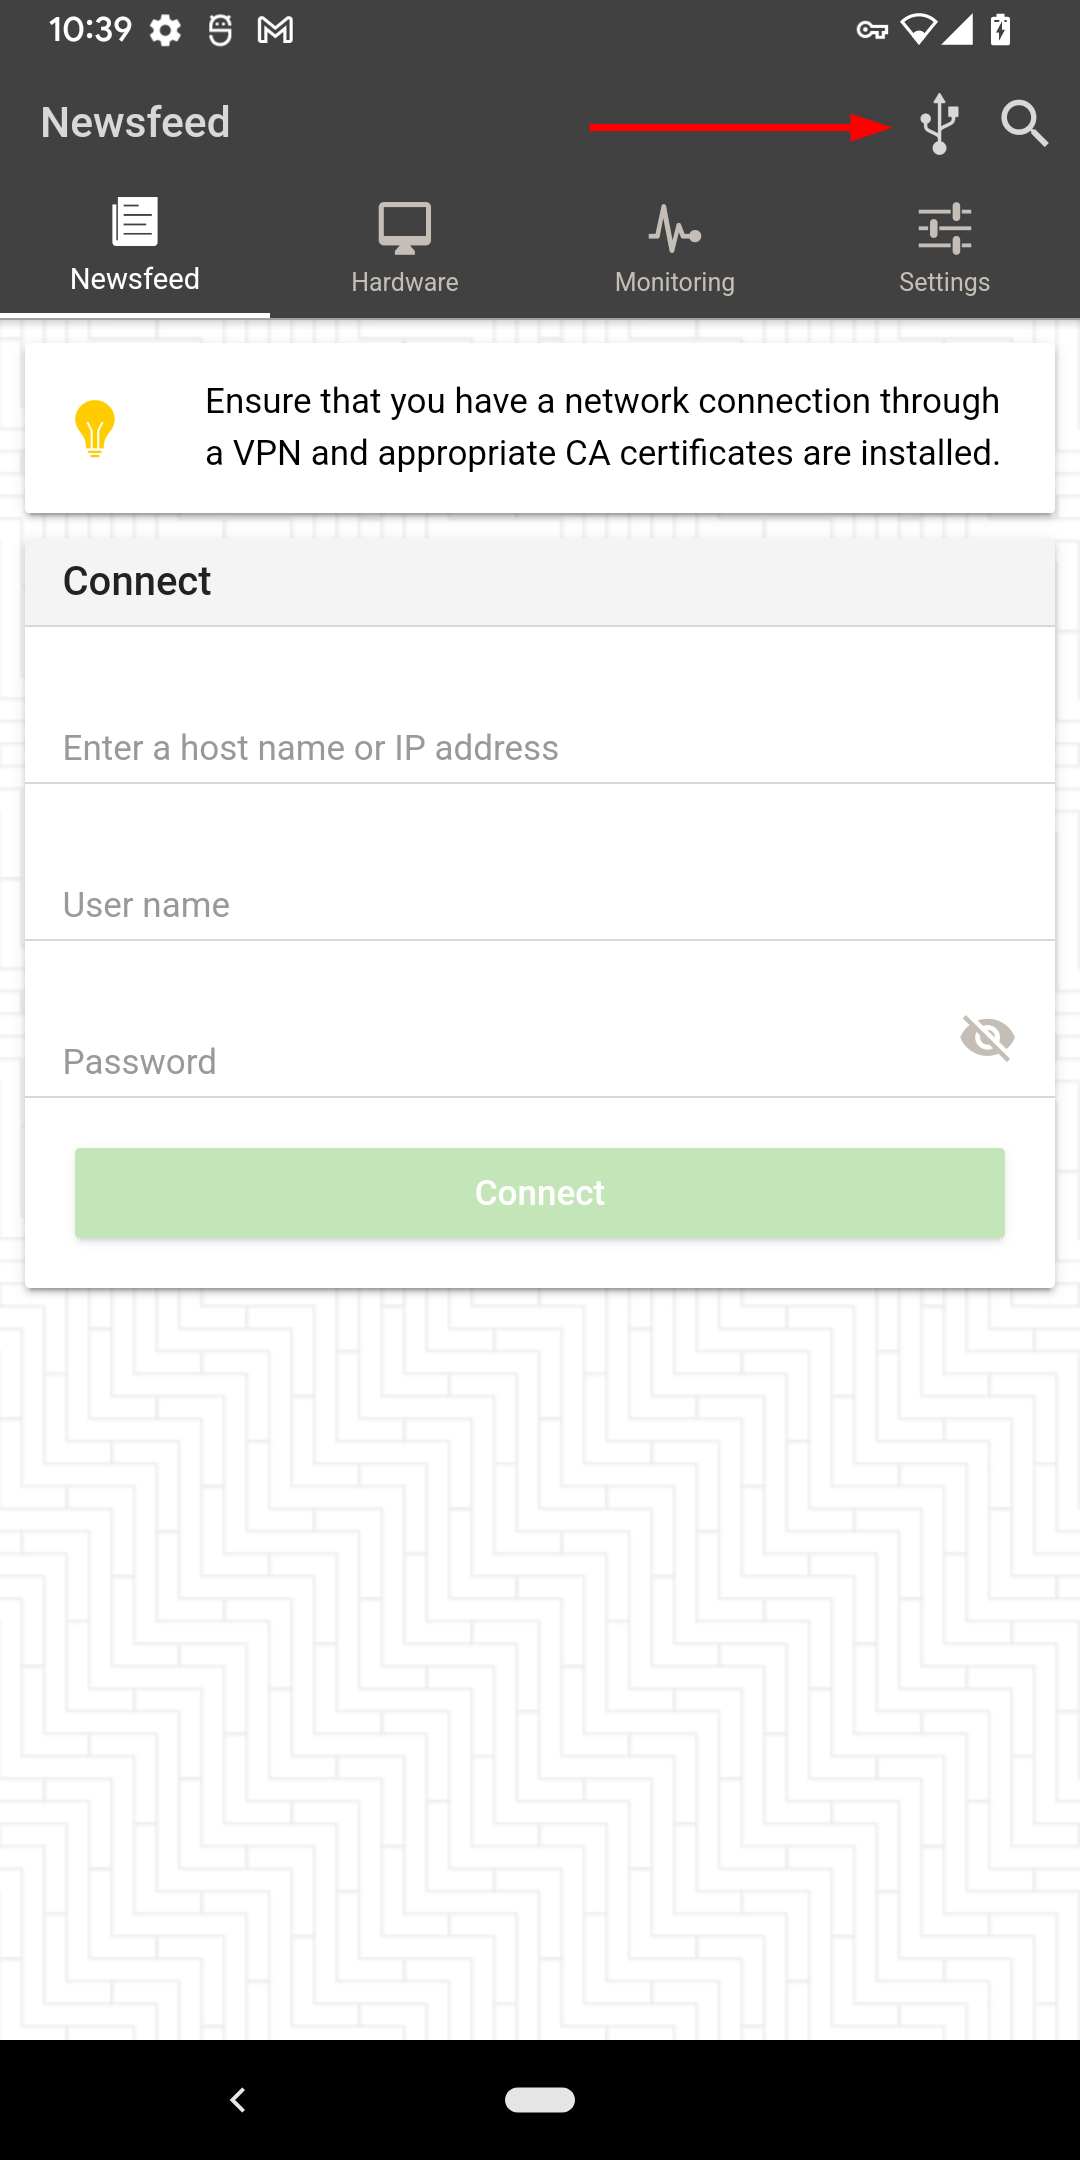
Figure 28. XClarity Mobile app Newsfeed page - Connect the phone to the server front management USB port (the port with a wrench sign), enable USB tethering on the phone OS setting if it wasn’t already done. The mobile app continuously verifies the connection and setting until they are satisfied (indicate by check mark).
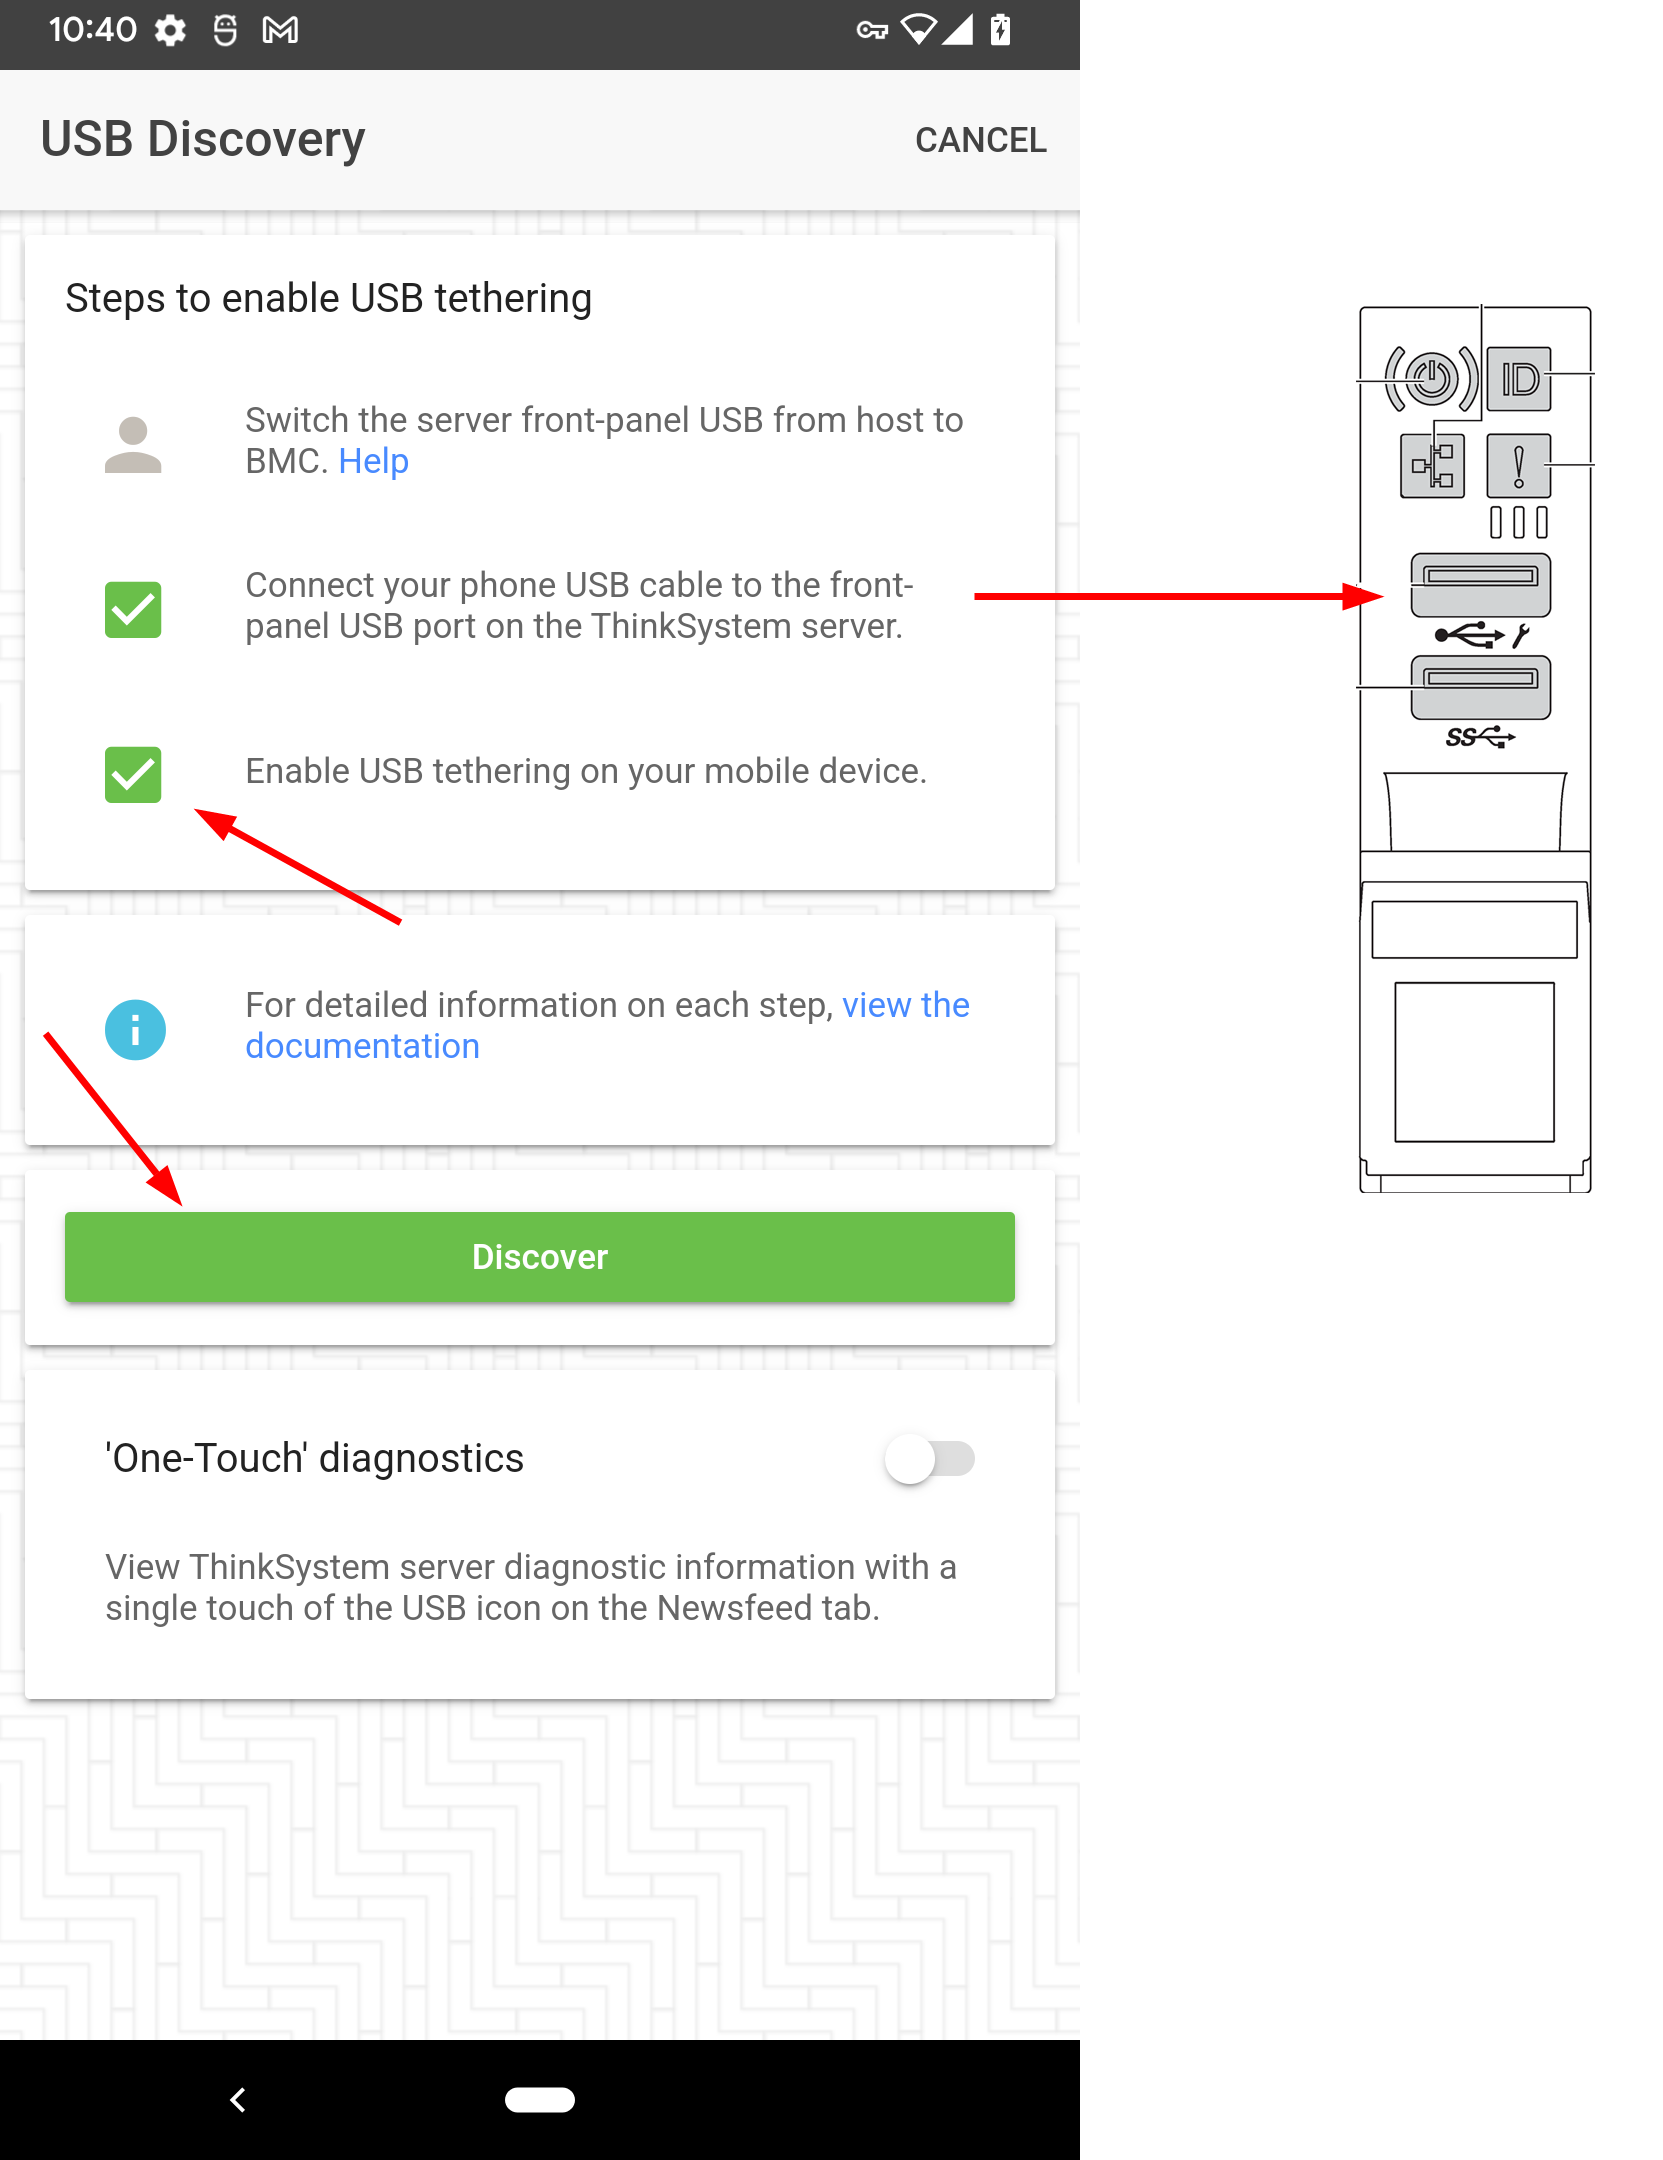
Figure 29. XClarity Mobile app USB Discovery page - Click on Discover.
- An item will be available under the section for USB attached server. Expand it to select the discovered server.
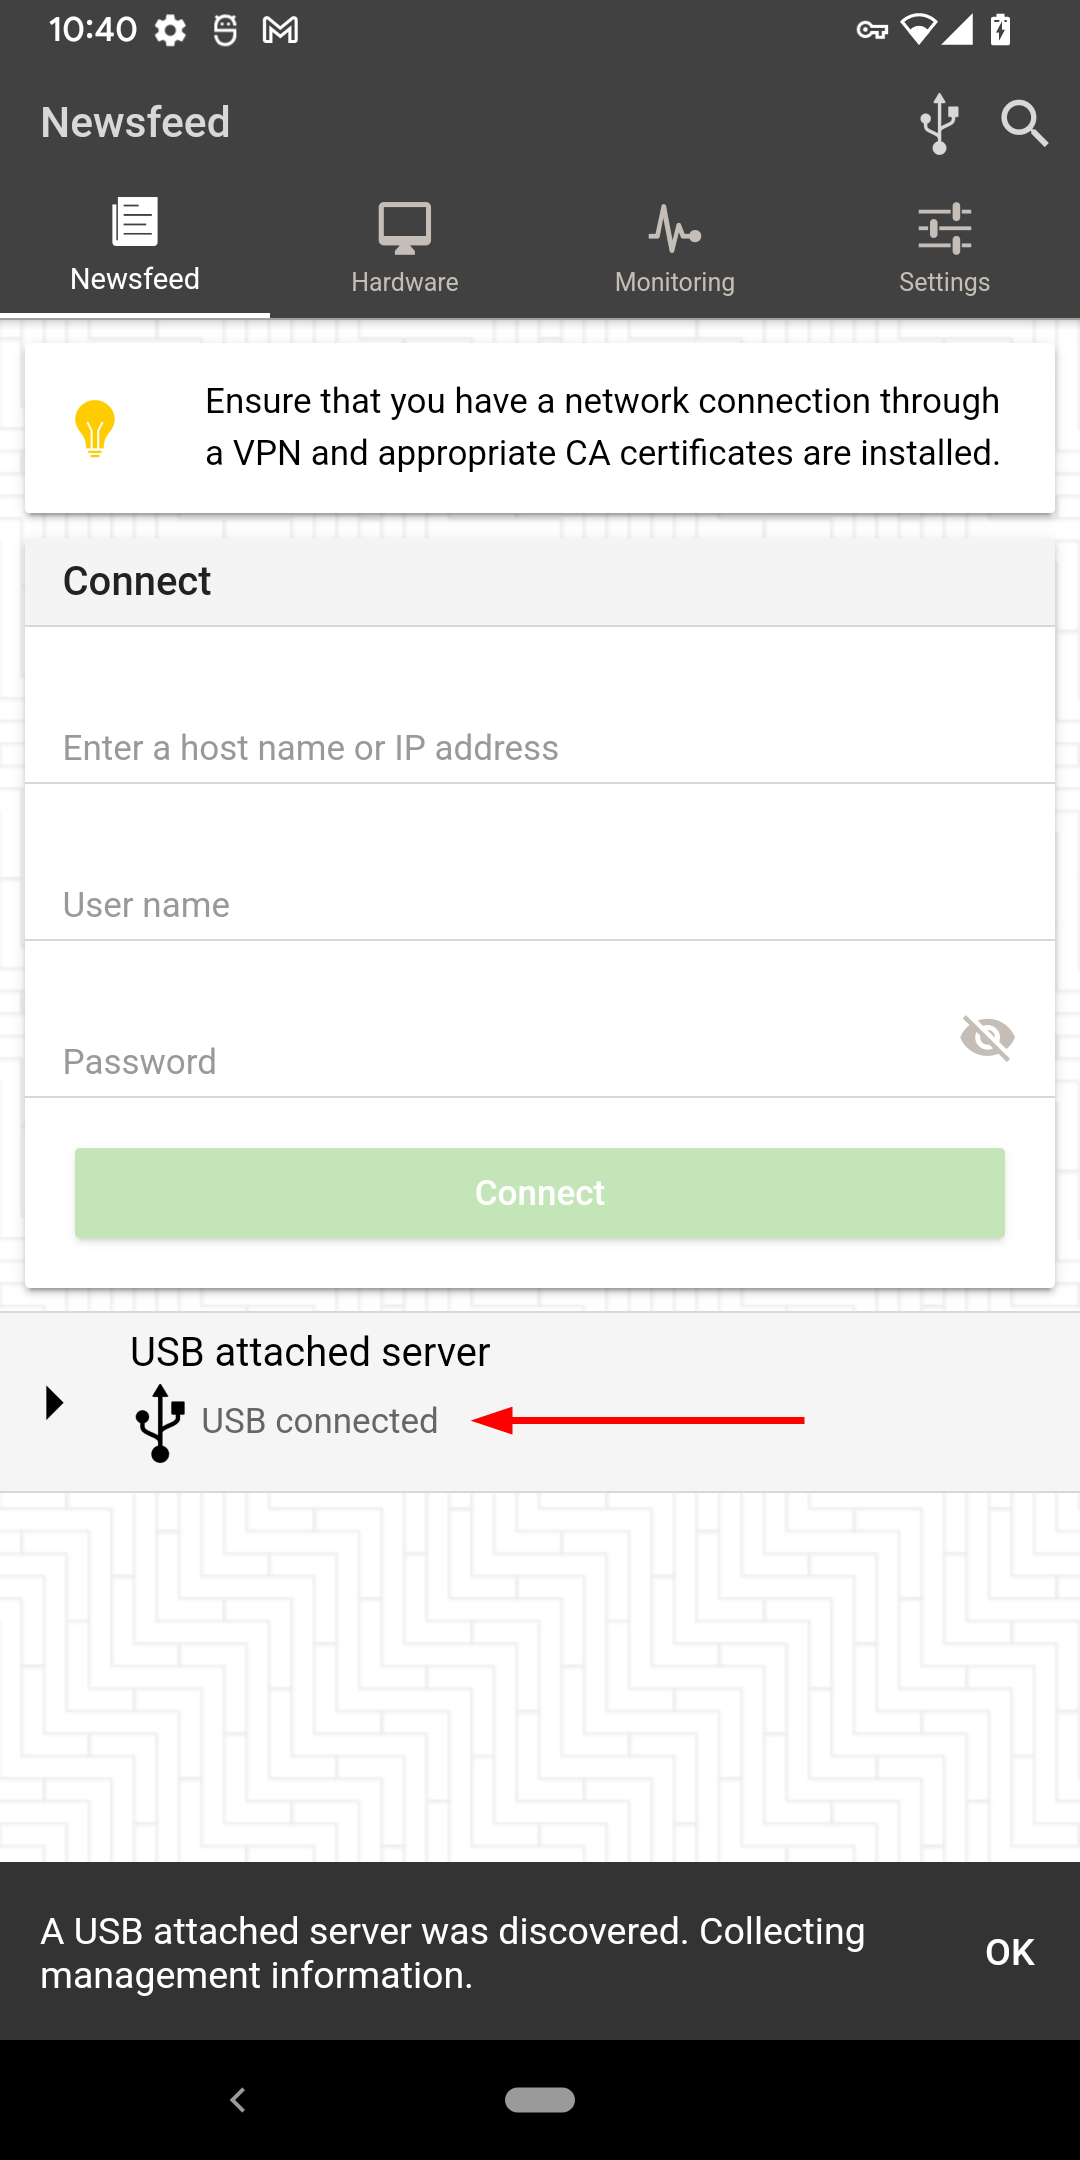
Figure 30. XClarity Mobile app USB attached server discovered - Open the top right options menu (3 vertical dots icon) and choose Login. Input the server’s XClarity Controller login credentials (e.g. USERID / xxx).
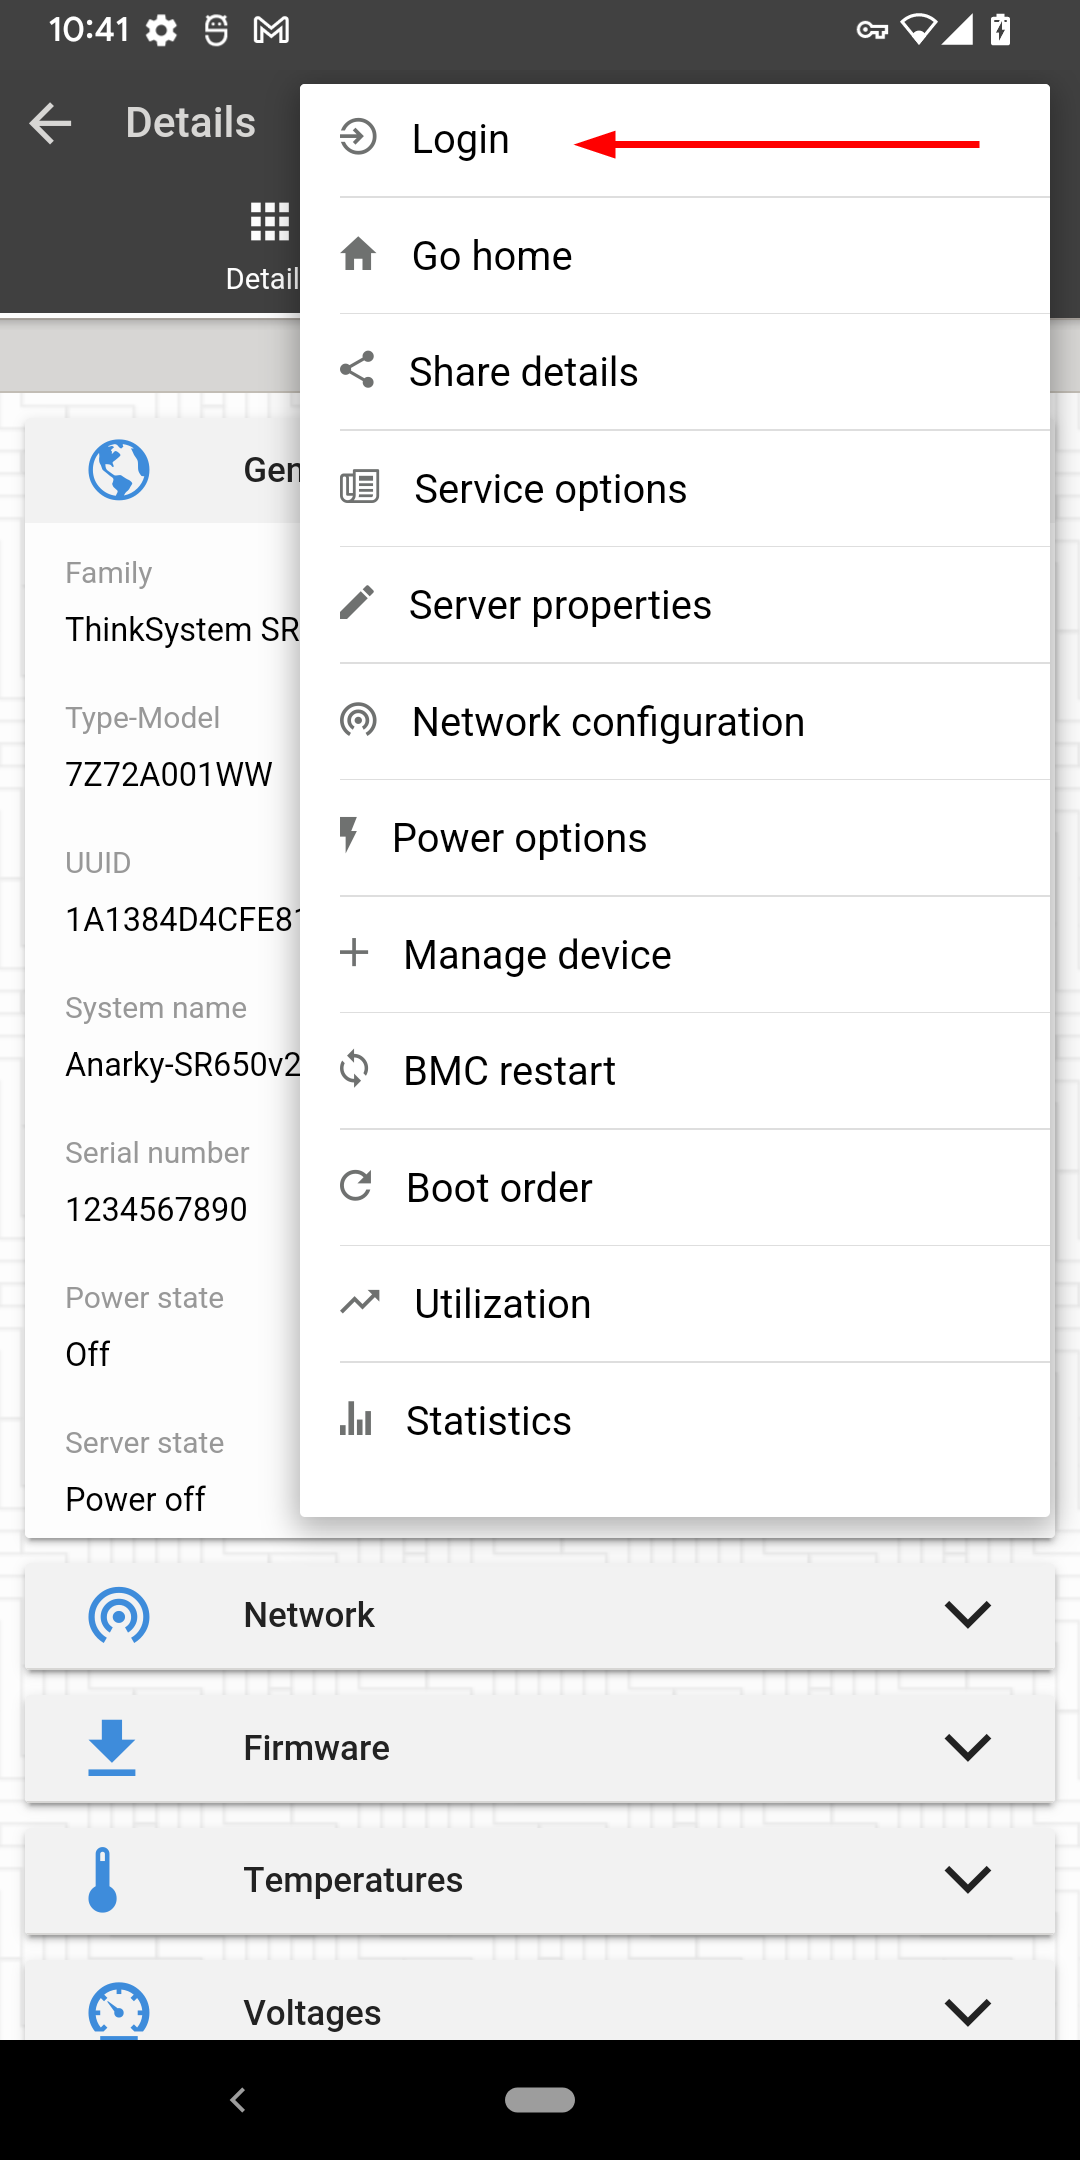
Figure 31. XClarity Mobile app server options menu - After successful login, open the top right options menu again, choose Service options and then Download service data. Answer Yes to the confirmation prompt.
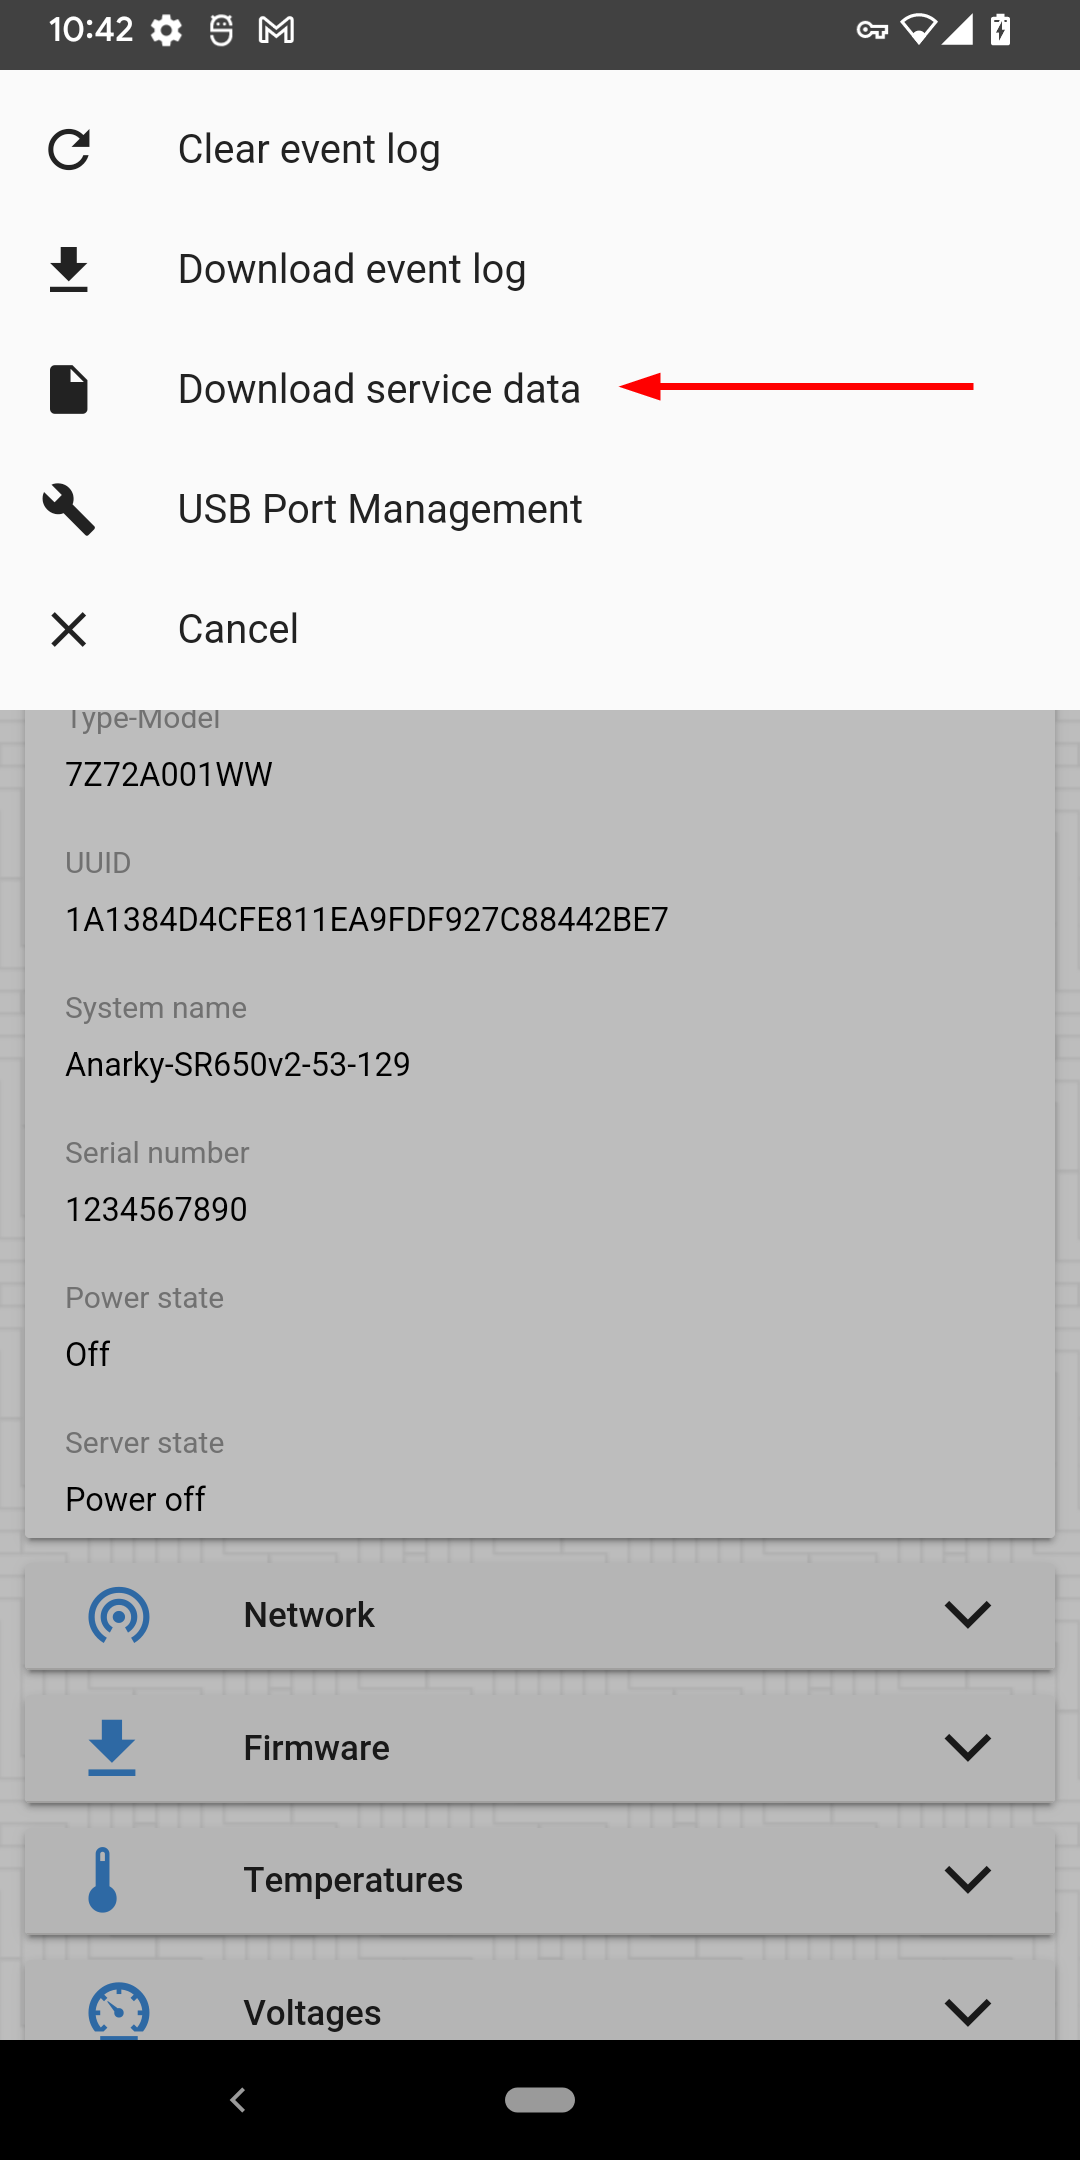
Figure 32. XClarity Mobile app Service options menu - When the data collection is completed, you will be given the option to save the file locally or hand it over to another app (send email, cloud storage, etc.).
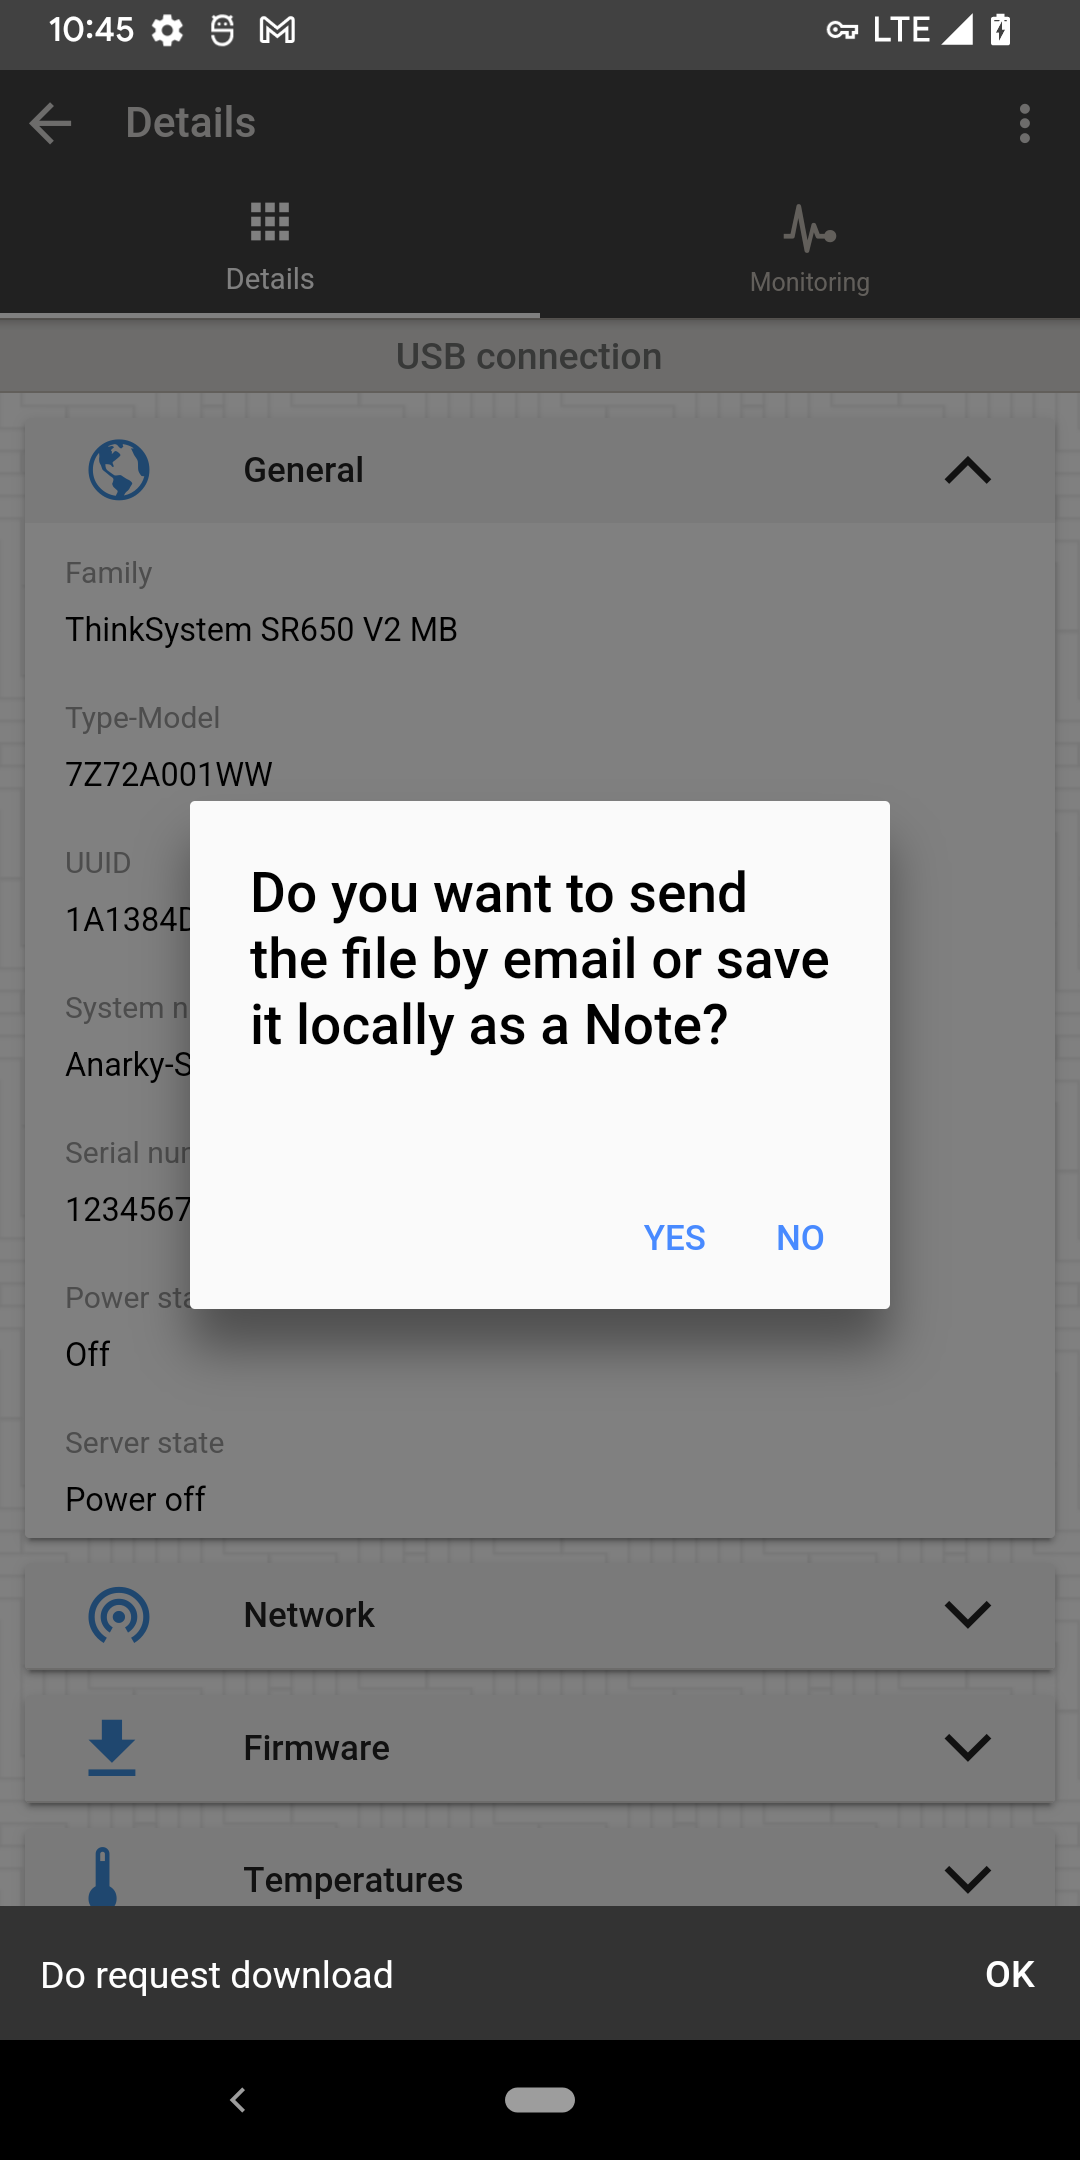
Figure 33. XClarity Mobile app file handling prompt
External diagnostics handset or Integrated diagnostics panel
Some ThinkSystem servers have an external diagnostics connector on the server front that you can use it to collect service data. It enables you to collect the debug log and write the file to a USB storage device. When writing files to a USB storage device, the device should be formatted as FAT, FAT32 or exFAT, and be plugged to the XCC controlled USB port at the server front.
Some servers have an integrated diagnostics panel at the server front that can be pulled out when needed. The instruction is same for both external and integrated devices, except that you don’t need to connect the integrated device manually.
Accessing the tool:
- Hardware: The external diagnostics handset must be purchased from Lenovo using part number 4TA7A64874. The integrated diagnostics panel is available in some server models.
- Documentation: In the Lenovo documentation home page, navigate to the desired server model, expand the section Server components > Front view > External diagnostics handset.
Instructions:
- Connect the USB storage device to the XCC controlled USB port (with the wrench icon).
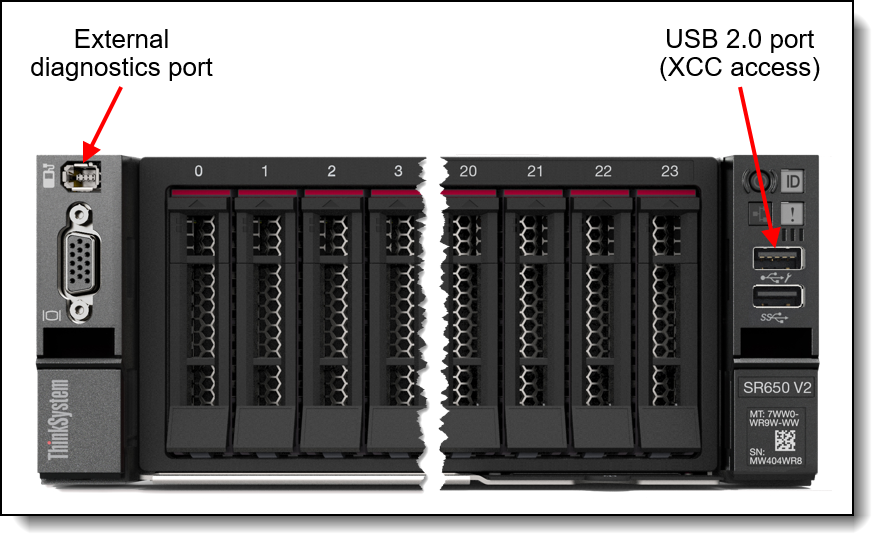
Figure 34. Front view of the ThinkSystem SR650 V2 - Connect the external diagnostics handset to the external diagnostics connector.
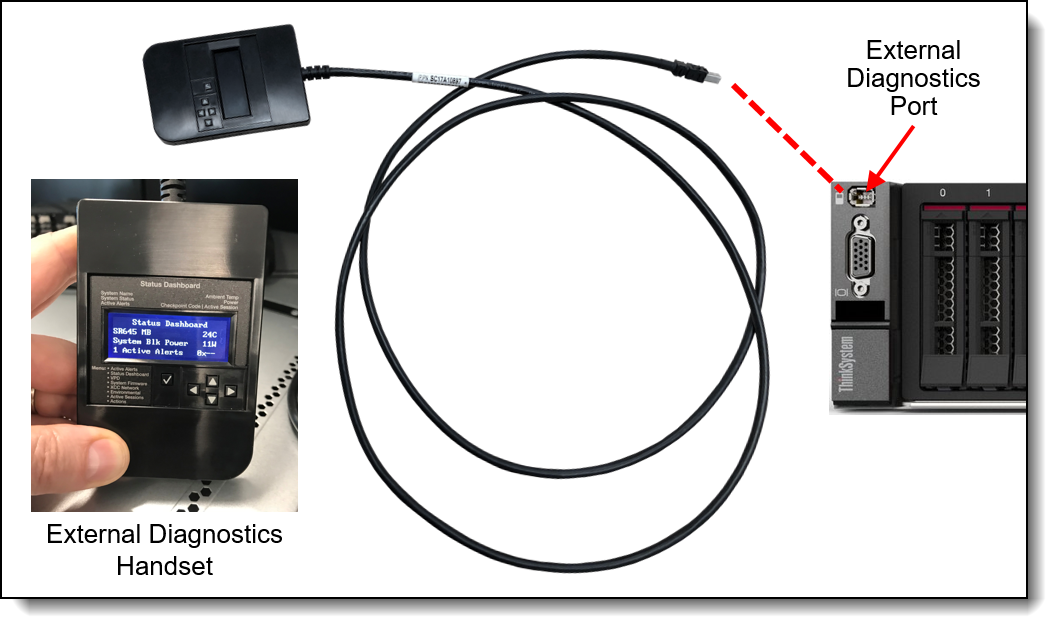
Figure 35. Connecting the external diagnostics handset to the connector - Scroll to the Actions menu, and then to Generate / Download FFDC Service Data.
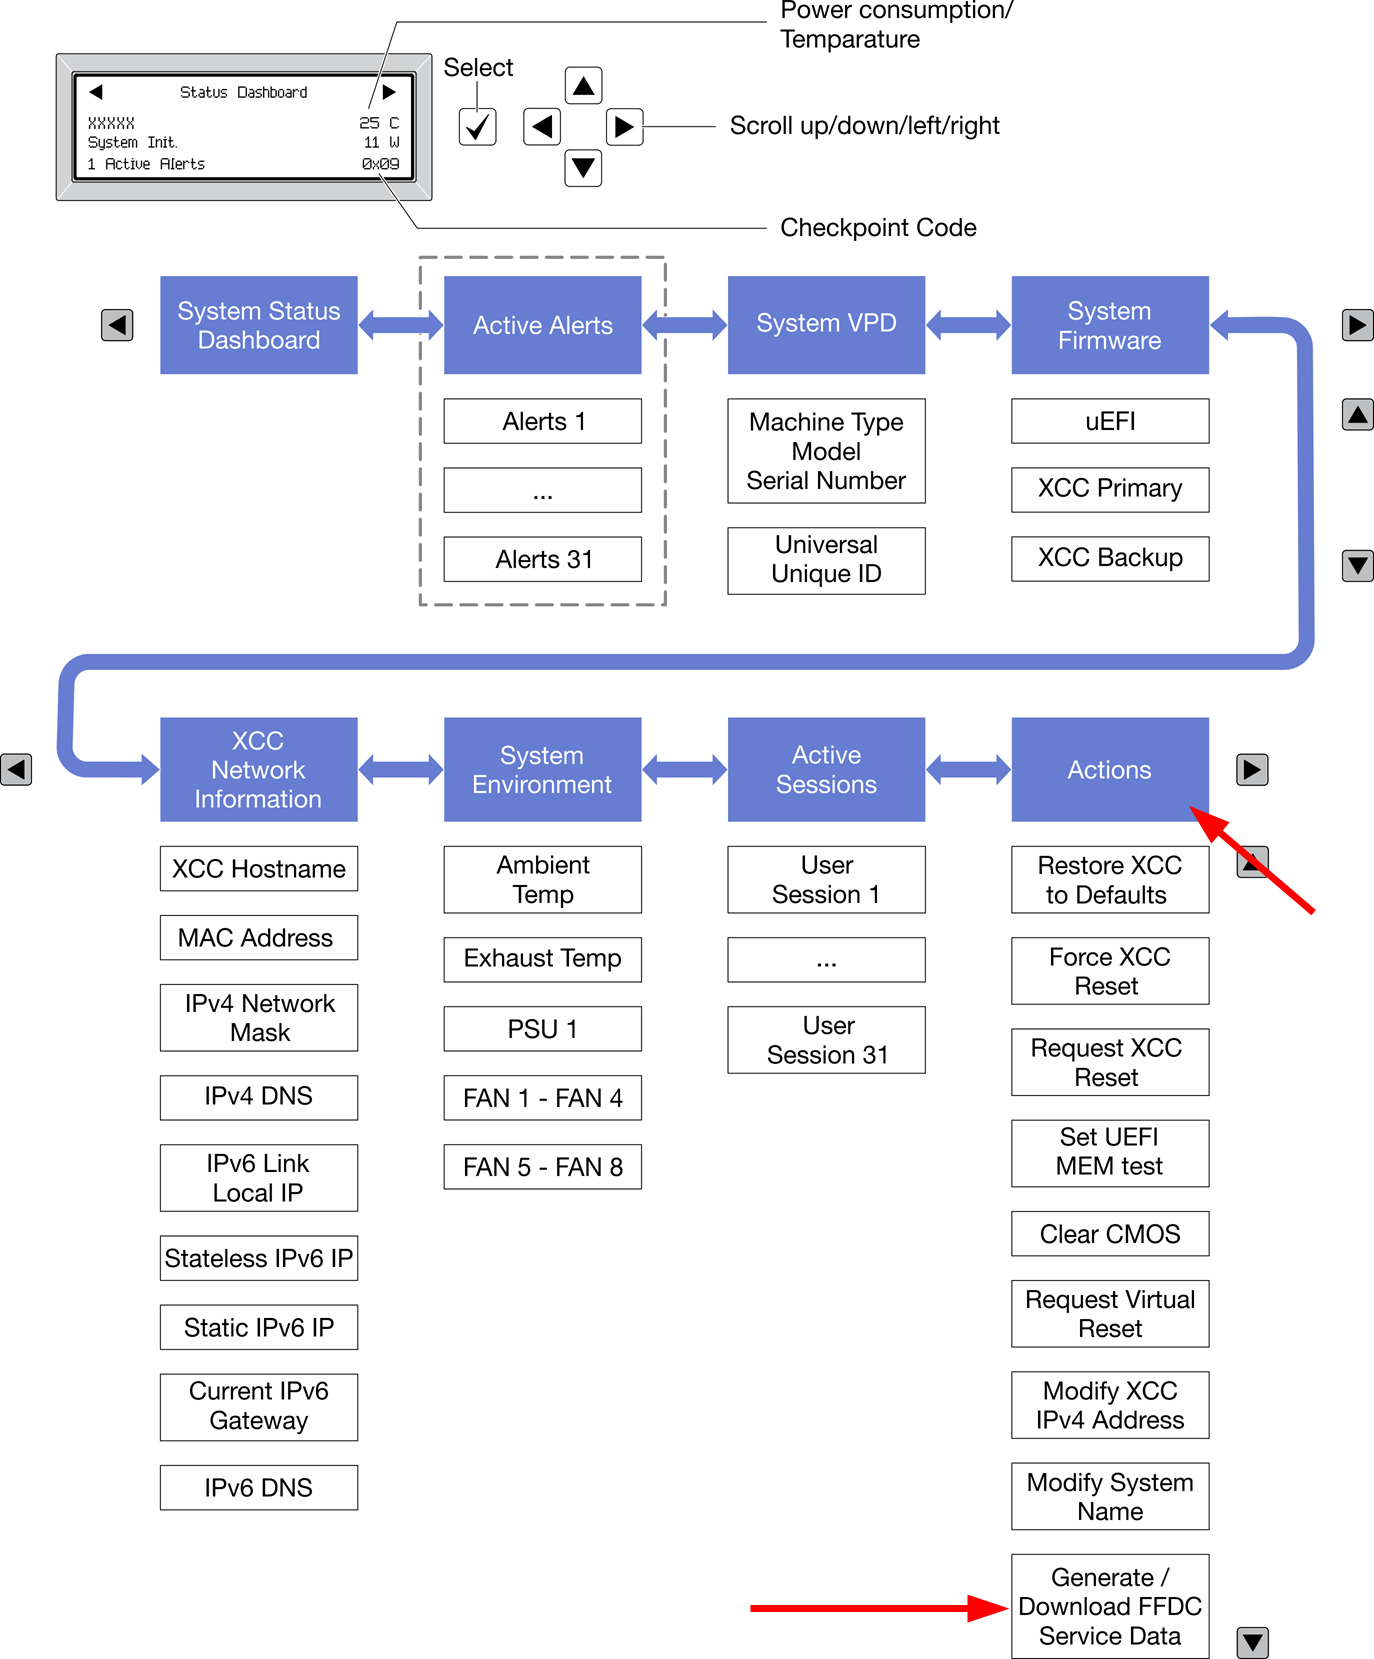
Figure 36. External diagnostics handset navigation flow - Trigger the action and follow the instruction on screen.
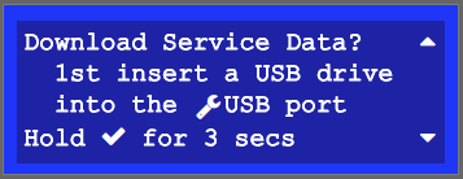
Figure 37. External diagnostics handset instruction on screen
Redfish API LogServices
Standard Redfish API can be used to collect the service data log from XCC and XCC2. Only the full service data log, a.k.a. debug log, FFDC, can be collected from this method.
Documentation: https://pubs.lenovo.com/xcc2-restapi/collect_bmc_diagnostic_data_post
Follow these steps to collect service data using this API.
- Initiate the service data collection task.
curl -L -s -k -u USERID:password -X POST 'https://10.1.1.224/redfish/v1/Systems/1/LogServices/DiagnosticLog/Actions/LogService.CollectDiagnosticData' -H 'Content-Type: application/json' --data '{"DiagnosticDataType" : "Manager"}' | jqResponse:
{ "TaskMonitor": "/redfish/v1/TaskService/f152fee2-1877-41ab-8614-3e7010dc5adb", "@odata.etag": "\"1708987633087\"", "Description": "This resource represents a task for a Redfish implementation.", "Messages": [], "HidePayload": true, "@odata.id": "/redfish/v1/TaskService/Tasks/9bceab02-d75e-441d-9fc7-cc4cecc96558", "StartTime": "2024-04-06T22:47:13+00:00", "@odata.context": "/redfish/v1/$metadata#Task.Task", "Id": "9bceab02-d75e-441d-9fc7-cc4cecc96558", "Name": "Task 9bceab02-d75e-441d-9fc7-cc4cecc96558", "@odata.type": "#Task.v1_6_1.Task", "TaskState": "New" } - Retrieve task status
curl -L -s -k -u USERID:Passw0rd1234 -X GET 'https://10.1.1.224/redfish/v1/TaskService/Tasks/9bceab02-d75e-441d-9fc7-cc4cecc96558' | jqResponse:
{
    "TaskMonitor": "/redfish/v1/TaskService/f152fee2-1877-41ab-8614-3e7010dc5adb",
    "@odata.etag": "\"1708987633158\"",
    "Description": "This resource represents a task for a Redfish implementation.",
    "Messages": [],
    "HidePayload": true,
    "TaskState": "Running",
    "StartTime": "2024-04-06T22:47:13+00:00",
    "@odata.context": "/redfish/v1/$metadata#Task.Task",
    "Id": "9bceab02-d75e-441d-9fc7-cc4cecc96558",
    "Name": "Task 9bceab02-d75e-441d-9fc7-cc4cecc96558",
    "@odata.type": "#Task.v1_6_1.Task",
    "@odata.id": "/redfish/v1/TaskService/Tasks/9bceab02-d75e-441d-9fc7-cc4cecc96558"
}
When data collection finishes, the response looks like this:
{ "EndTime": "2024-04-06T22:48:05+00:00", "TaskMonitor": "/redfish/v1/TaskService/f152fee2-1877-41ab-8614-3e7010dc5adb", "@odata.etag": "\"1708987685412\"", "Description": "This resource represents a task for a Redfish implementation.", "TaskState": "Completed", "Messages": [ { "MessageArgs": [], "@odata.type": "#Message.v1_1_2.Message", "MessageId": "Base.1.14.Success", "Message": "The request completed successfully.", "MessageSeverity": "OK", "Resolution": "None" }, { "MessageArgs": ["FFDC"], "@odata.type": "#Message.v1_1_2.Message", "MessageId": "LogService.1.0.DiagnosticDataCollected", "Message": "'FFDC' diagnostic data collected.", "MessageSeverity": "OK", "Resolution": "None." } ], "HidePayload": true, "StartTime": "2024-04-06T22:47:13+00:00", "TaskStatus": "OK", "@odata.context": "/redfish/v1/$metadata#Task.Task", "Id": "9bceab02-d75e-441d-9fc7-cc4cecc96558", "Name": "Task 9bceab02-d75e-441d-9fc7-cc4cecc96558", "@odata.type": "#Task.v1_6_1.Task", "@odata.id": "/redfish/v1/TaskService/Tasks/9bceab02-d75e-441d-9fc7-cc4cecc96558" } - Find the location of the service data file produced.
curl -L -s -k -u USERID:Passw0rd1234 -X GET 'https://10.1.1.224/redfish/v1/Systems/1/LogServices/DiagnosticLog/Entries' | jqResponse:
{ "Description": "A collection of DiagnosticLogEntry resource instances.", "Members@odata.count": 3, "@odata.id": "/redfish/v1/Systems/1/LogServices/DiagnosticLog/Entries", "@odata.context": "/redfish/v1/$metadata#LogEntryCollection.LogEntryCollection", "@odata.etag": "\"b99a3f5cb05232c73e0e1\"", "Name": "DiagnosticLogEntryCollection", "@odata.type": "#LogEntryCollection.LogEntryCollection", "Members": [ { "EntryType": "Oem", "OemRecordFormat": "Lenovo", "AdditionalDataSizeBytes": 18458411, "Description": "This resource is used to represent a log entry for log services for a Redfish implementation.", "Created": "2024-04-06T22:48:00+00:00", "DiagnosticDataType": "Manager", "AdditionalDataURI": "/imm_dump/FFDC/7D75_J1111111_xcc_240406-224717.tzz", "@odata.etag": "\"3bf9b21a8f3d27e8a1d\"", "@odata.context": "/redfish/v1/$metadata#LogEntry.LogEntry", "Id": "FFDC", "Name": "FFDC", "@odata.type": "#LogEntry.v1_13_0.LogEntry", "@odata.id": "/redfish/v1/Systems/1/LogServices/DiagnosticLog/Entries/FFDC" }, { "EntryType": "Oem", "OemRecordFormat": "Lenovo", "AdditionalDataSizeBytes": 0, "Description": "This resource is used to represent a log entry for log services for a Redfish implementation.", "DiagnosticDataType": "OS", "AdditionalDataURI": null, "@odata.etag": "\"3829a0dfb400266551b\"", "@odata.context": "/redfish/v1/$metadata#LogEntry.LogEntry", "Id": "FailureScreen", "Name": "Failure Screen", "@odata.type": "#LogEntry.v1_13_0.LogEntry", "@odata.id": "/redfish/v1/Systems/1/LogServices/DiagnosticLog/Entries/FailureScreen" }, { "@odata.etag": "\"12629f2da6cf2ae17ee\"", "@odata.context": "/redfish/v1/$metadata#LogEntry.LogEntry", "@odata.type": "#LogEntry.v1_13_0.LogEntry", "@odata.id": "/redfish/v1/Systems/1/LogServices/DiagnosticLog/Entries/MPFA" } ] } - Create a Redfish X-Auth-Token to be used for downloading the service data file.
curl -D header.txt -L -s -k -u USERID:password -X POST 'https://10.1.1.224/redfish/v1/SessionService/Sessions' -H 'Content-Type: application/json' --data ' { "UserName" : "USERID", "Password" : "password" }Response:
{ "UserName": "USERID", "@odata.etag": "\"1d08af338c332a22cf6\"", "Context": "", "Oem": { "Lenovo": { } }, "CreatedTime": "2024-04-06T22:53:42+00:00", "SessionType": "Redfish", "@odata.context": "/redfish/v1/$metadata#Session.Session", "Password": null, "Id": "25", "Name": "25", "@odata.type": "#Session.v1_5_0.Session", "@odata.id": "/redfish/v1/SessionService/Sessions/25" } - Find the X-Auth-Token in header.txt file.
cat header.txtResponse:
HTTP/1.1 201 Created Date: Sat, 06 Apr 2024 22:53:42 GMT Content-Type: application/json Transfer-Encoding: chunked Connection: keep-alive Location: /redfish/v1/SessionService/Sessions/25 X-Auth-Token: 552B0845264B078EEE52204EA11071CD0486134B ETag: "1d08af338c332a22cf6" OData-Version: 4.0 Content-Language: en Cache-Control: no-store Server: XCC Web Server Strict-Transport-Security: max-age=31536000; includeSubDomains Content-Security-Policy: default-src 'self'; connect-src *; script-src 'self'; img-src 'self' data:; style-src 'self'; font-src 'self'; child-src 'self'; object-src 'none'; frame-ancestors 'none' X-XSS-Protection: 1; mode=block X-Content-Type-Options: nosniff Cache-Control: no-cache, no-store, must-revalidate, private X-Frame-Options: DENY Referrer-Policy: same-origin X-Permitted-Cross-Domain-Policies: value X-Download-Options: value - Download the service data file.
wget --header="X-Auth-Token: 552B0845264B078EEE52204EA11071CD0486134B" https://10.1.1.224/imm_dump/FFDC/7D75_J1111111_xcc_240406-224717.tzz --no-check-certificateResponse:
Connecting to 10.1.1.224:443... connected.
HTTP request sent, awaiting response... 200 OK
Length: 18458411 (18M) [application/octet-stream]
Saving to: ‘7D75_J1111111_xcc_240406-224717.tzz’
7D75_J1111111_xcc_240406-2 100%[========================================>]  17.60M  4.35MB/s    in 4.0s
Tools summary
This section provides a summary of the links to all the tools covered in this document.
XClarity Controller 2 (XCC2)
- Download: This tool is embedded in the firmware of Lenovo ThinkSystem V3 servers.
- Documentation: https://pubs.lenovo.com/xcc2/
XClarity Controller (XCC)
- Download: This tool is embedded in the firmware of Lenovo ThinkSystem V1 and V2 servers (except ST50, ST50 V2, SR635, SR655).
- Documentation: https://pubs.lenovo.com/xcc/
XClarity Essentials OneCLI (LXCE)
- Download: https://datacentersupport.lenovo.com/us/en/solutions/lnvo-tcli
- Documentation: https://pubs.lenovo.com/lxce-overview/
XClarity Provisioning Manager (LXPM)
- Download: This tool is embedded in the firmware of Lenovo ThinkSystem servers.
- Documentation: https://pubs.lenovo.com/lxpm-overview/
XClarity Administrator (LXCA)
- Download: https://datacentersupport.lenovo.com/us/en/solutions/lnvo-lxcaupd
- Documentation: https://pubs.lenovo.com/lxca/
XClarity Orchestrator (LXCO)
- Download: https://datacentersupport.lenovo.com/us/en/solutions/lnvo-lxco
- Documentation: https://pubs.lenovo.com/lxco/
XClarity Integrator (LXCI) for Windows Admin Center
- Download: https://datacentersupport.lenovo.com/us/en/solutions/lnvo-lxci-wac
- Documentation: https://pubs.lenovo.com/lxci-overview/
XClarity Mobile app (LXCM)
- Download: From the phone’s app store: search for “XClarity Mobile” or use the following links:
- Documentation: https://pubs.lenovo.com/lxca/lxca_usemobileapp.html
External diagnostics handset or integrated diagnostics panel
- Download: The external diagnostics handset must be purchased from Lenovo. The integrated diagnostics panel is available in some server models by default or as an option.
- Documentation: Go to https://pubs.lenovo.com, navigate to the desired server model, expand the section Server components > Front view > External diagnostics handset.
Related product families
Product families related to this document are the following:
Trademarks
Lenovo and the Lenovo logo are trademarks or registered trademarks of Lenovo in the United States, other countries, or both. A current list of Lenovo trademarks is available on the Web at https://www.lenovo.com/us/en/legal/copytrade/.
The following terms are trademarks of Lenovo in the United States, other countries, or both:
Lenovo®
System x®
ThinkEdge®
ThinkSystem®
XClarity®
The following terms are trademarks of other companies:
Intel® and Xeon® are trademarks of Intel Corporation or its subsidiaries.
Linux® is the trademark of Linus Torvalds in the U.S. and other countries.
Microsoft®, Windows Server®, and Windows® are trademarks of Microsoft Corporation in the United States, other countries, or both.
Other company, product, or service names may be trademarks or service marks of others.
Configure and Buy
Please select a locale
Full Change History
Changes in the April 12, 2024 update:
- New section Redfish API LogServices
- Updated the links to the Lenovo documentation, now on: https://pubs.lenovo.com/software
First published: May 4, 2023


